Comparing 2000 Active VDI Desktops for XenDesktop MCS and PVS on FlashStack CI
The Challenge
When moving forward with a Citrix XenDesktop deployment, one of the most important early decisions is figuring out which deployment method makes the most sense for your scope of operations, users and applications. There are advantages and challenges for both Machine Creation Services (MCS) and Provisioning Server (PVS); so it can be a tough decision that will likely have long-lasting implications on your VDI project.
We decided it would be interesting and hopefully helpful to compare and contrast how those two solutions perform on FlashStack Converged Infrastructure at a reasonably high scale in order to show what you might expect for each solution by using Login VSI as a workload generator.
Test Setup
In Figure 1 we can see a connectivity diagram for our FlashStack test environment. Notice that it is fully redundant with no single point of failure.
Figure 1: Citrix XenDesktop connectivity diagram for 2000 desktop MCS and PVS comparison
In order to minimize variables and make this as much of a direct comparison between MCS and PVS as possible, we took the following steps:
- We setup a Windows7x64 VM, installed VMware Tools, Office 2013, all patches and the additional Login VSI target software (Adobe, Java, etc..).
- We then cloned this VM so that one would be used for MCS golden image and the other for the PVS vDisk to minimize any OS-level differences.
- All Windows 7×64 guest OS optimizations were executed via the Virtual Delivery Agent and PVS vDisk Imaging installer(s). No other guest OS optimizations were performed in order to show an ‘out of the box’ comparison.
- All linked-clones and target devices are running 2vCPUs and 2GB of RAM and the remaining hardware components were also identical. Both had a static 2048GB page file set and the PVS-based desktops had a 10GB write-cache with the page file pointed to that partition as that is a best practice.
- We used the same two Delivery Controllers, two StoreFronts and two Provisioning Servers (PVS testing only) for our testing.
- We used the same set of Cisco UCS B200M4 servers for our 20 host cluster for both MCS and PVS. All servers were at the same firmware version throughout this testing. When we switched from MCS testing to PVS testing, we rebooted all servers.
- No ESXi profiles or settings were altered during this test. In the cluster DRS and HA were both enabled and DRS was set to the most aggressive setting in order to load balance CPU and memory utilization amongst the hosts as much as possible during the test.
- We used the same Cisco Nexus 9396PX and Cisco MDS 9148S switches in both simulations.
- Both pools were made up of 2,000 desktops or 100VMs per UCS host.
- We used the Login VSI Knowledge Worker in Benchmark mode for each test and ran the test three times each in order to confirm low variability in results.
For each solution, we will highlight the following metrics:
- Pure Storage Performance (IOPS, bandwidth, latency)
- Login VSI: VSImax v4, login time, application performance
- ESXi host CPU and memory utilization
Test Results
We found that there was no major differences between the MCS and PVS technologies on any component of the FlashStack – even when running 2000 concurrent desktops. ESXi CPU and memory utilization was close to identical in both solutions with sufficient headroom for additional operations to take place.
Figure 2 shows an overlay of the two twenty host Login VSI VSImaxv4 charts (read more here about this metric) and we can see that in this case MCS (purple) provided a slight performance advantage over PVS (blue) but it is not major enough to warrant making a design decision on this factor alone.
Figure 2: Relative VSImax v4 performance chart for 2000 desktop MCS (purple line) and PVS (blue line)
One of the more important measures of performance for VDI is the amount of time it takes from when a user clicks ‘connect’ in Citrix Receiver to when they have a usable desktop. Below we can see the logon times for each virtualization technology we again see near identical performance – though with PVS we did encounter a bit more variability than MCS in all tests.
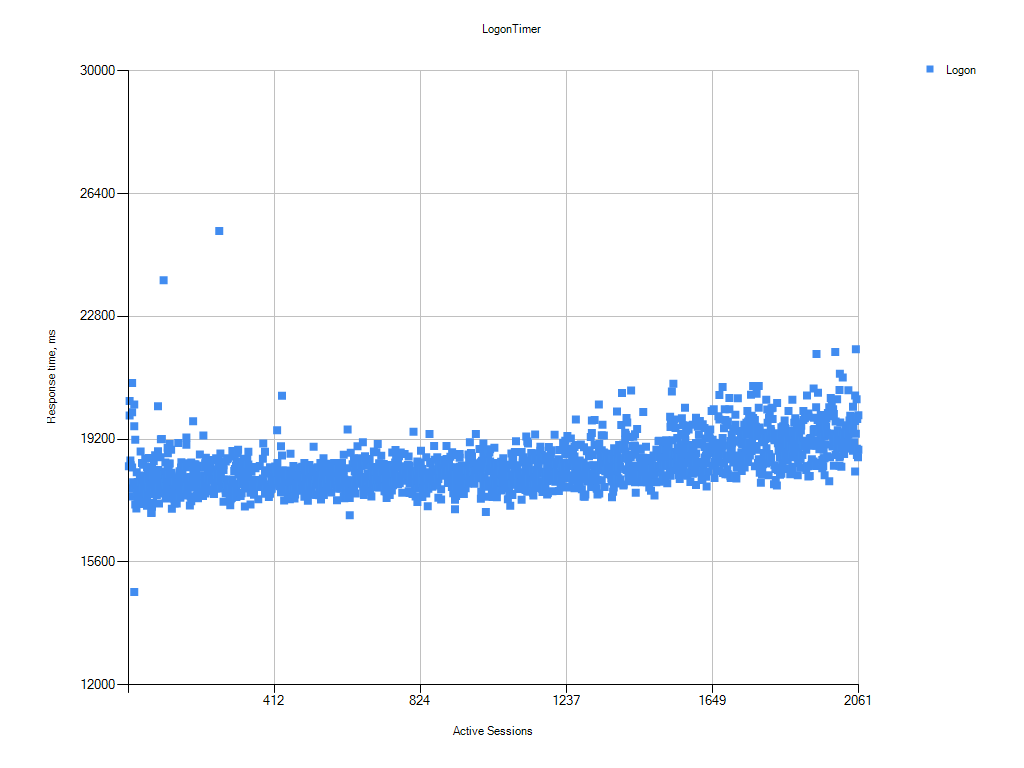
Figure 3: Login VSI Logon Timer chart for 2000 MCS desktops (note that the y-axis is in milliseconds)
Figure 4: Login VSI Logon Timer chart for 2000 PVS desktop (note that the y-axis is in milliseconds)
Finally, when we compared array performance (the below measurements were taken when the 2000th desktop launched in each simulation) we do see that substantially more read-bandwidth is needed for the MCS solution relative to PVS. However, latency remained at the sub millisecond level throughout the entirety of all simulations. Full storage and host performance metrics of this test are available in the Design Guide.
Conclusion
From these results, we have found that Pure Storage will provide an outstanding end-user experience for either PVS or MCS technologies. With that being said, customers who are more focused on VM density per array will likely see a slightly better result using PVS over MCS due to the lower read-IOPs requirements associated with that technology.
As always, we encourage our customers to test with their own environments in order to best understand the implications of each solution to arrive at the optimal solution for their unique project.
We would like to invite you to our inaugural user conference in San Francisco March 14th and 15th where you will have the opportunity to engage and compare notes with your peers, talk to industry experts, see inspiring keynotes and game-changing product demos.
Lastly, this blog post is only a small excerpt from a much more comprehensive design guide where we show how easy it is to setup and scale your Citrix XenDesktop project while maintaining incredible performance from hundreds to thousands of desktops.