

Logs are a very useful way to track operations and resolve issues/bugs that show up. However, log coverage can be a tricky item to handle. Not enough logging makes it hard to track what is actually happening in a system. This is because it provides an incomplete picture. Excessive logging can also be an issue. This can degrade performance and/or provide too much information, which in turn makes it hard to troubleshoot issues. This post will cover a couple different approaches for identifying coverage and the benefits of each approach.
Analyzing log coverage for all code paths
This approach analyzes what sections of code are not being logged. We can accomplish this by adding instrumentation to each type of scope area (e.g., branches, methods, etc) and making sure that test suites actually drive the code paths.
We can add some additional instrumentation in each scope area to track write operations to either files or standard output. The algorithm can analyze the code at multiple levels (e.g., INFO, DEBUG, etc) for additional granularity. While it’s not 100% accurate to assume all write operations are logging operations, this could be further refined by scanning the code block for logging statements from typical logging libraries (e.g., log4j). The downside to tracking write operations is that I/O instrumentation can be fairly expensive.
Testing out the algorithm
To test out this type of analysis, I put together a team consisting of Miranda Steele, Patrick Lee, Nikiti Sirohi and myself at a Pure sponsored hackathon. The team decided to do a simplified implementation on top of an open source code coverage tool against a Java based project that uses log4j. We limited the scope area to just identify method coverage and didn’t differentiate between different log levels.
We require that there is at least one logging statement within a method’s implementation for coverage. The tool did not determine how impactful those logging statements were. We also didn’t factor in any methods from abstract classes or interfaces. With these limitations in place, it took us less than a day to implement the analyzer.
Analyzing the results
The Java project that we tested our coverage analyzer contained:
- 1,081 classes
- 11,927 methods
- 46,644 lines of code
The project only logged 368 methods out of 11,927 based on the after analysis report. This meant that only 3% of all methods within the project did any kind of logging.
Obviously there could have been further refinement. For example, we could have chosen to ignore any type of getter or setter method and any method containing fewer than three lines of code, but it’s doubtful that it would raise the log coverage percentage by a significant amount. The real question is whether such a low log coverage percentage represents a problem. It’s possible it might not be, as excessive logging makes relevant data points harder to find when troubleshooting. We really just need the key code paths logged.
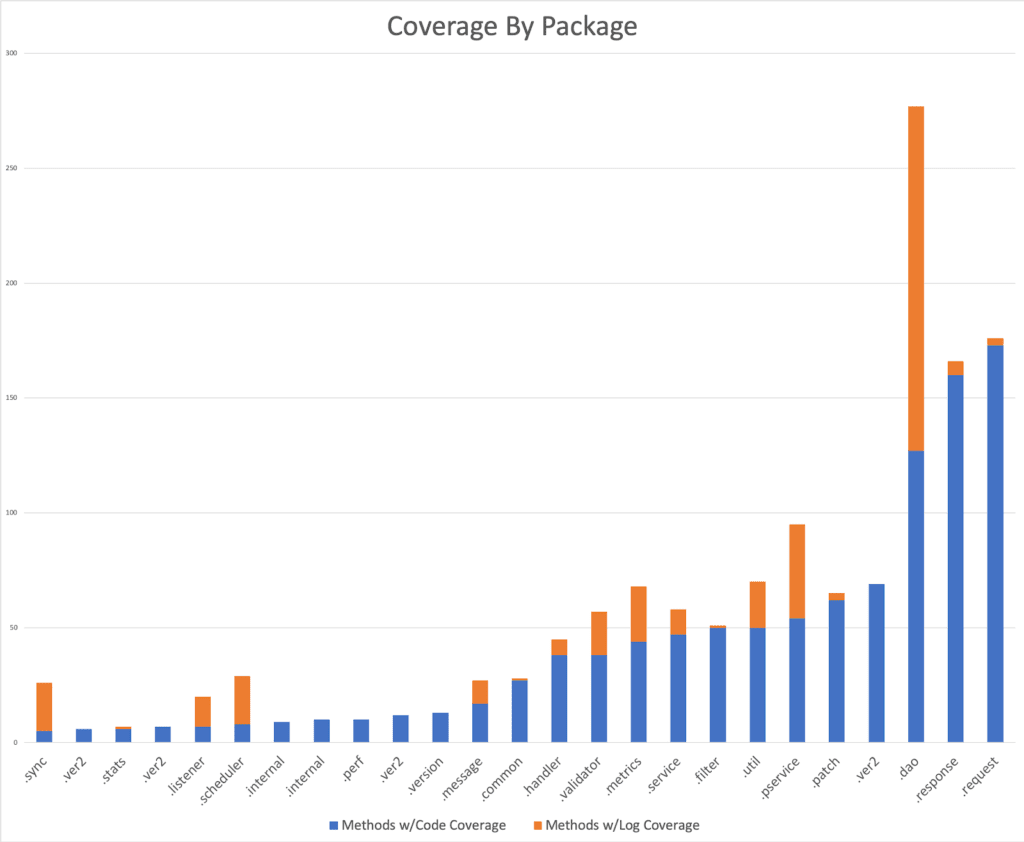
The real usefulness of this approach is that it helps the developer identify whether the key areas of their code are logging or not. We can get granularity at the package and class level in our analysis. The following chart shows our log coverage for methods by package, juxtaposed with our code coverage.
It is reasonable to assume that a developer would know which code sections are important and therefore should have more coverage. The downside to this approach is that it requires someone knowledgeable with the code base to interpret the results. Because this may not always be possible, the following sections will describe different approaches for analyzing logs based on usage patterns.
Analyzing log coverage based on code usage
Like code coverage tools, many monitoring tools exist to determine the runtime behavior of an application. For example, various Java tools identify what percentage of the CPU a method might consume over a period of time. This information helps identify methods with subpar CPU performance.
By taking such information and associating lines in a log file to a specific method, we can come up with some interesting correlations. The associations between a line in a file to the originating method could be done by monitoring writes to the file, or even more simply through entry and exit logger statements in the method itself. The following table shows an example of what a monitoring tool’s output could look like.
| Method Name | CPU % | Log % |
| MethodA | 45.0 | 42.3 |
| MethodB | 38.2 | 20.1 |
| MethodC | 14.2 | 22.5 |
From the table above, we can see that MethodB has a higher CPU utilization rate when compared to its log output in relation to total log output. We also see the opposite for MethodC. This would indicate that perhaps MethodB doesn’t log enough and MethodC logs too much for how often they are used.
The benefit of this approach is that we can get some correlation between CPU usage and log generation on a per method basis. The downside is that we’re assuming what’s being logged is useful information. We’re also making a huge assumption that logs would be written in a similar style without accounting for variance in verbosity between the log statements.
Analyzing log coverage based on log usage
At the end of the day, logs are only useful if they provide useful enough information to the log consumers. In the case of troubleshooting issues, the consumers are the people trying to do the root cause analysis. The key part here will be quantifying the usefulness of the log statements for those people.
Useful metrics from defect tracking tools
Most defect/bug reporting tools will provide several common metrics that we can use to determine the effectiveness of log statements.
- When a ticket was opened
- When a ticket was resolved
- The ticket resolution status
- Log statements included in the ticket
- Log statements included in comments
- When a comment was added
Ultimately, we want to correlate resolution time with logging statement. Over a large enough data set of tickets, we can determine which log lines lead to quicker resolution and infer that those lines are effective. We can apply the same logic to lines which didn’t lead to a quick resolution meaning and infer that those lines are not useful and can potentially be improved.
This approach also requires the ability to associate lines and code blocks. As discussed earlier, there are several ways of doing this.
The benefit of this approach is that we can now effectively determine which are actually useful for root cause analysis and defect resolution as well as identifying areas which could use more logs. The main thing to watch out for in this approach is that the defect resolution time could be slightly skewed if it also includes the time to produce a fix which is different from when the root cause analysis was done. This could easily be solved by the defect tracking tool if it has a progress state to specifically identify specifically when root cause analysis was completed.
Conclusion
As enterprise software developers, we are continually looking for ways to improve the quality of our products for our customers from reliability to documentation. One often overlooked area is product support as the support team is typically separate from the development team. By providing better analysis of logs in order to write better ones that helps to quickly identify and resolve issues, this leads to better support and a tighter coupling between the two teams.
Here at Pure Storage, we strive to always make sure the logs we write and phone home are full of relevant data for normal support operations to more advance predictive support such as Pure1 Meta™. Take some time to explore our support features as well as ensuring that your applications have just the right amount of logging for your needs.