Faster software development = faster feature delivery = happier Pure customers.
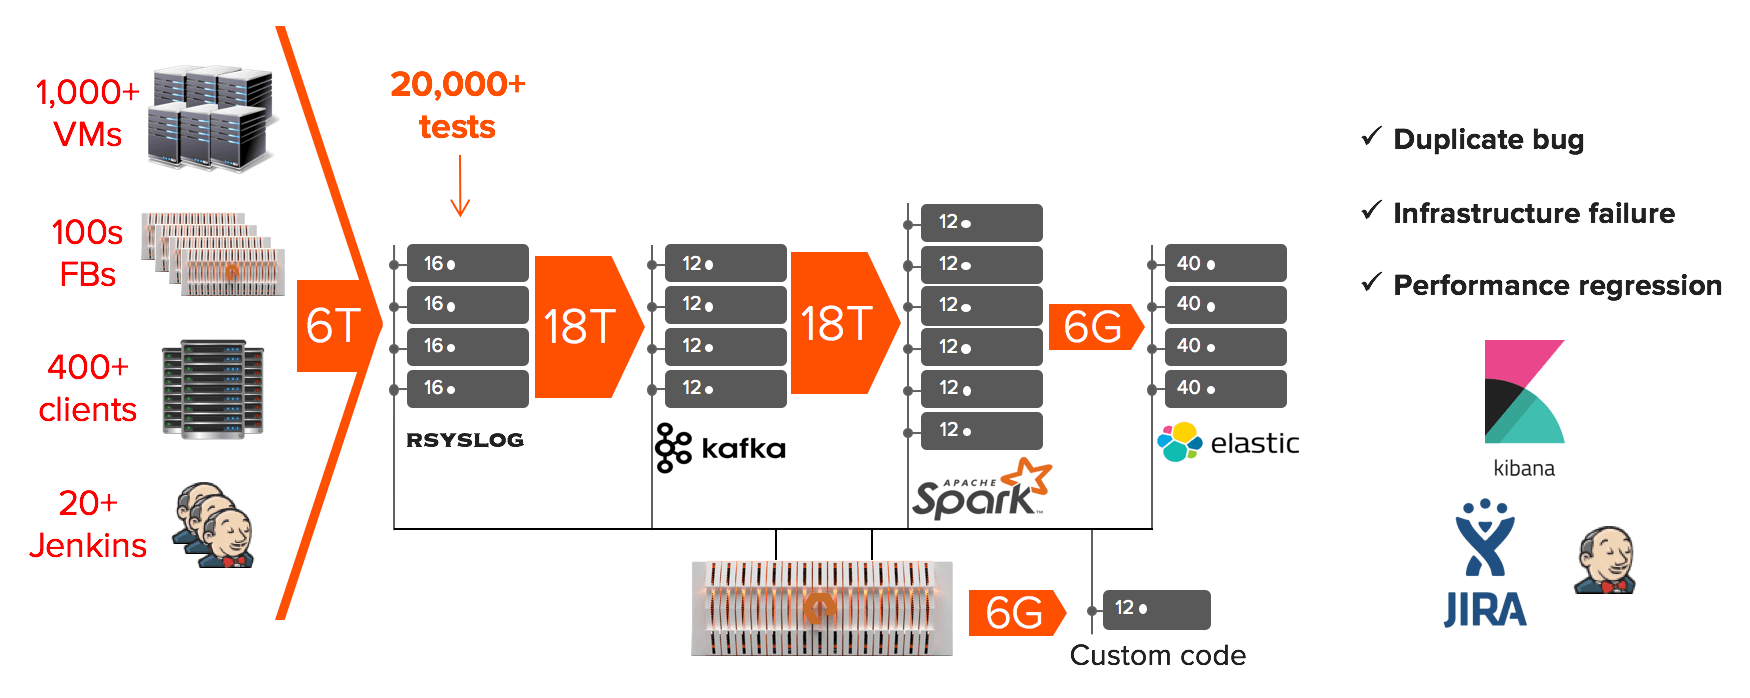
At the same time, quality of our software has always been our number one priority. From day one, all software development at Pure adopted a continuous integration model and made a heavy investment in automated testing to ensure software quality. Test failures provide insights, but they can be hard to debug due to the complexity of software systems as well as failure injection tests. As we grow our engineering team, the infrastructure to support them, and the numbers tests we run per day, manual log review for debugging test failures does not scale due to the immense amount of work. We have built a software QA infrastructure using modern big data tools like Spark and Kafka, enabling us to process 50 billion events per day and provide feedback in real-time under five seconds.
This blog post describes how we’ve leveraged automated software testing from the beginning, the challenges our processes faced when scaling, and how we’ve augmented our automated testing infrastructure with a real-time big data analytics pipeline to solve these problems.
We Began with Hundreds of Tests per Day
Early on in the development of the FlashBlade, a scale-out file and object storage platform, we were a small team of engineers with a handful of prototypes for the product and a small amount of servers to simulate our customers’ load. At this stage, we made a conscious decision to do as much automated testing during development as possible. Our goal was to have a fast iteration cycle for software development that included a continuous integration model.
During these early days of development, we had dozens of tests that amounted to hundreds of test runs per day. This model served us well, as it enabled an agile development cycle during prototyping and until we released FlashBlade. We were able to quickly identify and fix bugs, which in turn increased the quality of our product.
And Grew to Twenty Thousand Tests per Day
Customer demand for FlashBlade ramped up very quickly, so we started to increase our engineering force accordingly. As the number of engineers grew, the number of features that we were developing in parallel also grew. And with more features come more tests which required more infrastructure to support them (FlashBlades, Servers, Jenkinses, etc). We even had to invest in a feature simulation system of the FlashBlade to allow us to scale these testing efforts. Each factor grew so rapidly that we quickly found ourselves running over 20 thousand tests per day.

Implication: Twenty Full Time QA Engineers
For any given test, there are multiple points of failure: FlashBlade, network, client, code line, test case, etc. These multiple components make identifying the cause of a test failure – also referred to as triage – a complicated task. For the sake of discussion, let’s assume it takes 10 minutes for an engineer to root-cause a test failure. Now, if we assume a 5 percent failure rate, we end up with 1,000 failures per day. This means we would need a full time team of (1000 failures per day) * (10 minutes / failure) / (hour / 60 minutes) * (day / 8 hours) ~ 20 engineers to triage these failures.
With all of the opportunity that FlashBlade has for innovating and bringing more solutions to market, we plan to double our engineering team making this problem larger and more complex.
Reality: Three Full Time QA Engineers
Our triage team today only has a handful of members. Without any automated triage to supplement those people, a huge percentage of test failures would go untriaged. Valuing software quality as we do, it was unacceptable to not be able to reap the benefits of having our automated testing framework for continuous integrations. This is the reason we set out to build an automated solution that would help with this process.
Our goal was to come up with a system to:
- Minimize duplicate triaging efforts: A given fault could cause test failures across multiple test suites, jenkins instances, clients, VMs, etc. This caused our manual engineering efforts to be duplicated if two individuals triaged the same fault in different scenarios. Thus, we decided to build a system that would minimize those efforts. The system should consume patterns (signatures) that identify a given fault and use them to triage all future and past test failures caused by it.
- Save our logs for future use: We have had cases where a fault introduced really early in the development cycle (years ago) was causing unexpected interactions with newer parts of the system. The system should save all infrastructure related logs for years in case we ever need to go back and find the first occurrence of a certain signature.
- Scale system easily: Our engineering team will double in the next year, which will require twice the amount of infrastructure to support them. The system should be able to easily scale to consume more patterns and analyze more logs as we grow our team.
- Provide real-time results: For certain infrastructure issues, we want to minimize the time between a fault and its alerts/identification to allow for faster corrective action. The system should be able to identify a new failure within seconds.
- Extract performance metrics from the logs: Like most products, we run performance tests regularly to ensure that a new version of the FlashBlade software will not cause performance regressions. We are also testing the FlashBlade in many corner case scenarios (e.g. blade is down, certain network links down, etc). The system should be able to collect performance metrics across all test cases and scenarios.
Deploying Modern Big Data Tools for State-of-the-Art QA Automation
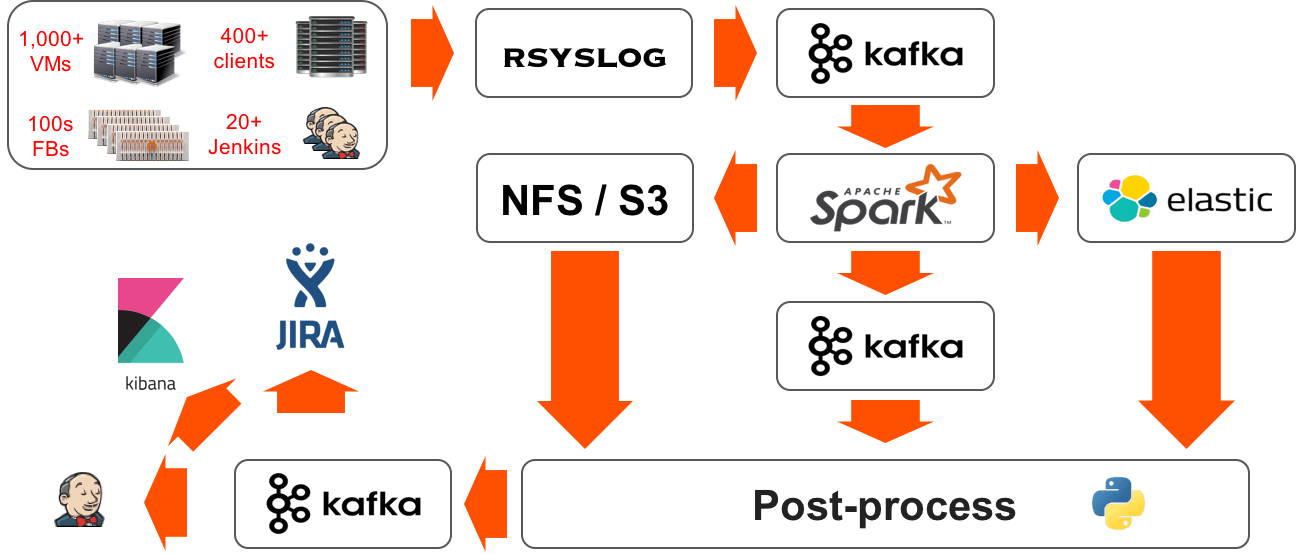
Because of the requirements laid out above, we decided to go with a big data analytics pipeline that streams and processes all of the logs from our infrastructure. Here are the steps from our pipeline:

Logging
All of our infrastructure uses logger and we have a pre-task in jenkins that configures each component with an rsyslog configuration to send the logs into a centralized cluster of rsyslog servers. This pre-task polls a service to find the least utilized rsyslog server for load balancing.
Rsyslog
This is the first and last step of the pipeline where the logs are processed in the order they are created. Because of this, each line needs to be tagged with enough metadata so that it can be uniquely identified after being processed. Rsyslog converts each log line into json extracting some fields that describe its origin (host, component, time, etc.) and adding other fields about the test it was running at the time (jenkins job, jenkins build id, VM, branch, etc.).
These rsyslog servers are also in charge of preserving all of our logs for posterity – in json format. Because of all the metadata we are adding, the amount of data being sent out from rsyslog triples in size. We preserve all of our logs for posterity in a pre-classified format using the filesystem’s directory tree structure <FlashBlade>/<year>/<month>/<day>/<host>/<log>. This format helps us lower the granularity of our log files for re-processing. On the other hand, we create half a million files per day to be stored on a FlashBlade. Processing all of that metadata for re-processing our logs takes advantage of the high IOPS provided by the FlashBlade.
Kafka
A property we found valuable for a data analytics pipeline was the decoupling of consumer and producer of the data. Having kafka as a broker in between any 2 components of the pipeline (e.g. rsyslog and Spark) allows us to stop/start the consumer and continue ingesting data from the point at which it previously stopped. Also, based on our retention policy (3 days), we are able to attach other consumers (e.g. our test pipeline, look-backs for new signatures) and replay certain periods repeatedly. Kafka is configured to use the FlashBlade via NFS as its backing storage; this means that we can dynamically change our retention policy without having to worry about the infrastructure supporting the Kafka cluster.
Spark
The compute core of our pipeline that classifies and filters the streamed logs and outputs to the filesystem (NFS/S3). We use the filesystem directory structure to hold the metadata of the filtered lines in the following format: <filtered_logs>/<FlashBlade>/<year>/<month>/<day>/<hour>/<host>/<signature_id>/<text>. This classification system allows us to have an hourly granularity per signature (and all of its relevant patterns) which speeds up our post-processing of the filtered log lines. We found a large part of our use cases were going to be met with the processing of unique lines and we optimized for the real-time aspect of it: Spark does not perform any aggregations, only filtering and classification.
Post-processing
We use python consumers from a Kafka queue to do post-processing and aggregation of unique patterns for multi-line and scripted signatures. Scalability of our post-processing layers comes intrinsically from the ability to have multiple concurrent consumers pulling from a given Kafka topic.
Reporting
We use JIRA internally to track our engineering work items, bugs, and test failures. Thus, JIRA is the ideal location for our users (software engineers) to encode their signatures and for our analytics pipeline to report new reproductions of a given signature. We use Jenkins for resource management of our hardware as well as test scheduling; our analytics pipeline also marks test failures as ‘known failure’ by augmenting the description of a given Jenkins build.

The analytics pipeline that we’ve built has a significant impact to our engineering organization across multiple fronts:
- Removes all duplicate engineer’s efforts for triage.
- Allows for real continuous integration by differentiating existing vs new failures.
- Tracks performance regressions in all scenarios (not just performance testing).
- Allows passive collection of patterns and issues that are orthogonal to the tests.
- Helps engineers track patterns for their feature over time.
While modern analytics tools were critical in building our QA pipeline, the speed and agility of the experimentation and growth of our pipeline would not have been possible without a disaggregated compute and storage layer. This architecture allows us to spin up large amounts of compute nodes on demand and point them at the FlashBlade for a large batch analytics job without disrupting our existing ones. FlashBlade is the infrastructure on which the pipeline is built. It consolidates all the data silos into a single, shared system and enables real-time performance for any data, any access patterns, and any applications. To learn more, please read our blog on why FlashBlade for modern analytics here.


