As we have discussed in previous blogs, if doing performance testing with real-world applications is not an option, our suggestion is to attempt to model your workload with load generators approved by application vendors, or to use a generic load generator like Oracle’s vdbench tool.
It is our belief that properly modeling your workloads, and then scaling them, is a superior storage performance testing methodology than just doing classic performance corners testing.
In THIS previous blog post we discussed a very simple way to approximate the reducibility rates of various workloads with Oracle’s vdbench tool.
Here we will discuss a simplistic method to approximate the IO size mixes of VSI (Virtual Storage Infrastructure), VDI (Virtual Desktop Infrastructure), Oracle, and SQL workloads with Oracle’s vdbench tool. In future blog posts, we will build upon this to develop more sophisticated workload modeling scripts.
Recently, we did some internal analysis of Pure1 data to determine the IO size & read/write mixes on FlashArrays that we know predominantly do VSI, VDI, Oracle, or SQL workloads. Of course, these will be different for every deployment. However, while not perfect, this gives us enough for simplistic workload modeling.
Also, a while back, we conducted an analysis of the reducibility rates for various workloads.
In summary, the following was found:
- Databases had an average reducibility rate on Purity between 2:1 to 4:1
- VSI had an average reducibility rate on Purity between 5:1 to 9:1
- VDI had an average reducibility rate on Purity between 10:1 to >20:1
What follows below are charts of the results of the most recent Pure1 analysis, plus code snippets, to simplistically approximate these workloads with Oracle’s vdbench tool.
- The degree of randomness is defaulted to 80% with the “seekpct=80” parameter.
- For Oracle we’ll assume a Purity reducibility rate of 3.9:1 under load
- This can be approximated on Purity 4.5.x with a “Oracle vdbench 5.04.03 3-4k-3” workload
- For SQL we’ll assume a Purity reducibility rate of 2.5:1 under load
- This can be approximated on Purity 4.5.x with a “Oracle vdbench 5.04.03 2-4k-2” workload
- For VSI we’ll assume a reducibility Purity rate of 5.2:1 under load
- This can be approximated on Purity 4.5.x with a “Oracle vdbench 5.04.03 4-4k-4” workload
- For VDI we’ll assume a reducibility Purity rate of 10.0:1 under load
- This can be approximated on Purity 4.5.x with a “Oracle vdbench 5.04.03 7-4k-8” workload
- Adjust these as you see fit.
==
dedupratio=4
dedupunit=4k
compratio=4
wd=wd_vsi_read,rdpct=100,xfersize=(4k,25.68,8k,26.31,16k,6.4,32k,7.52,60k,10.52,128k,9.82,252k,7.31,504k,6.19,984k,0.23,1032k,0.02),seekpct=80,range=(0,100),sd=sd*
wd=wd_vsi_write,rdpct=0,xfersize=(4k,59.62,8k,14.81,16k,8.97,32k,6.13,60k,5.35,100k,1.63,212k,1.39,432k,1.95,920k,0.14,1032k,0.01),seekpct=80,range=(50,100),sd=sd*
rd=rd_vsi_ramp,wd=wd_vsi*,forrdpct=57.40,curve=(20,35,50,65,80,90,92,94,96,98,99),iorate=curve,interval=1,elapsed=300,maxdata=999t,forthreads=16
VSI – Read IO size mix

VSI – Write IO size mix

VSI – Percentage of Total IOs by IO Size
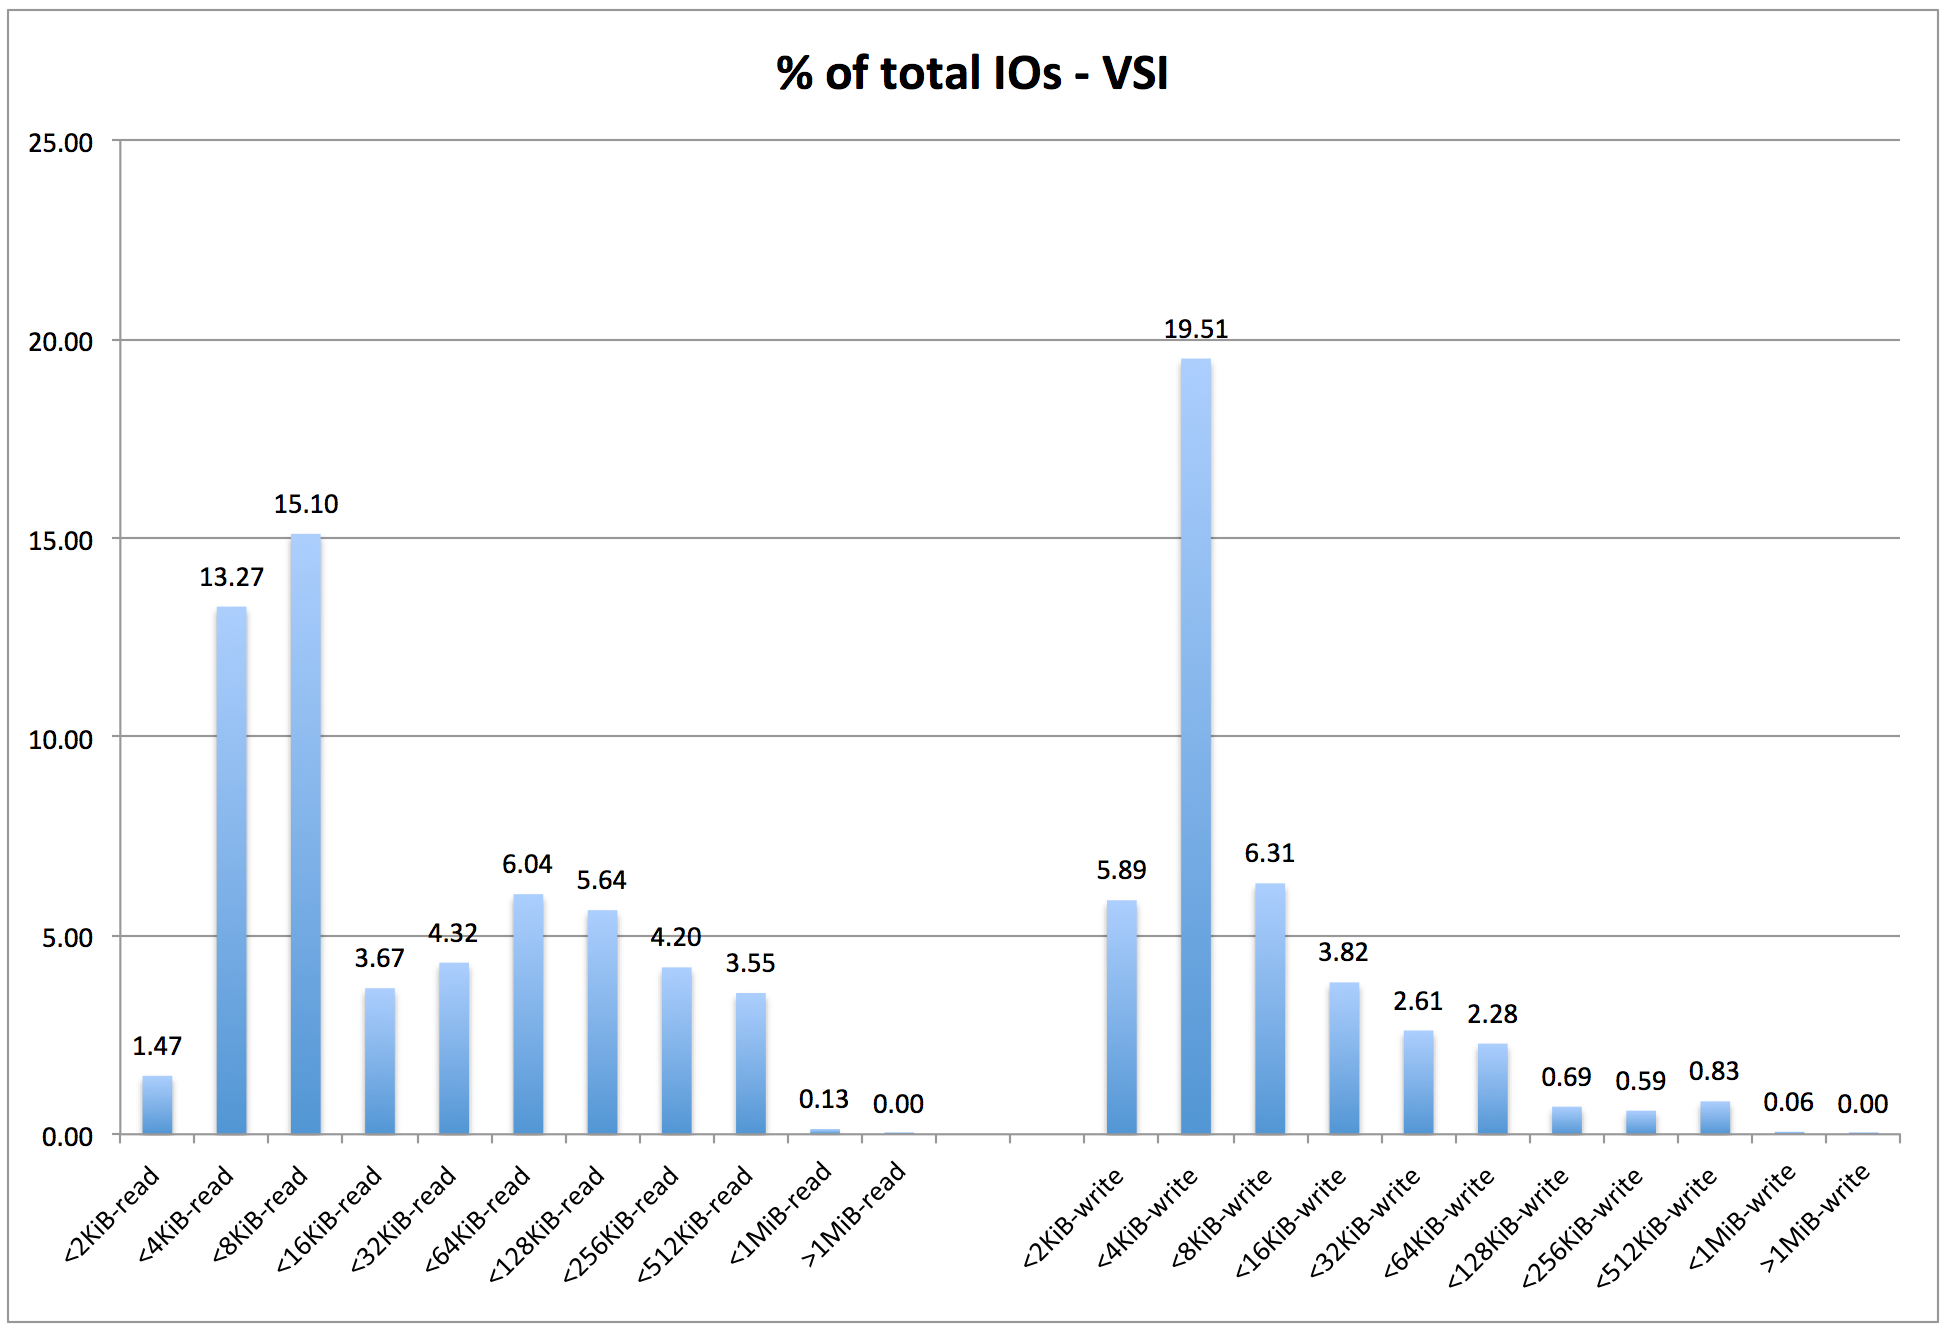
VSI – Percentage of Total Data Throughput by IO Size

==
dedupratio=7
dedupunit=4k
compratio=8
wd=wd_vdi_read,rdpct=100,xfersize=(4k,39.35,8k,9.37,16k,16.47,32k,10.37,64k,12.86,116k,5.45,220k,3.33,472k,1.96,984k,0.84,1032k,0.01),seekpct=80,range=(0,100),sd=sd*
wd=wd_vdi_write,rdpct=0,xfersize=(4k,61.11,8k,13.05,16k,8.41,28k,3.46,60k,9.31,104k,1.05,240k,2.91,372k,0.33,876k,0.33,2028k,0.04),seekpct=80,range=(50,100),sd=sd*
rd=rd_vdi_ramp,wd=wd_vdi*,forrdpct=59.44,curve=(20,35,50,65,80,90,92,94,96,98,99),iorate=curve,interval=1,elapsed=300,maxdata=999t,forthreads=16
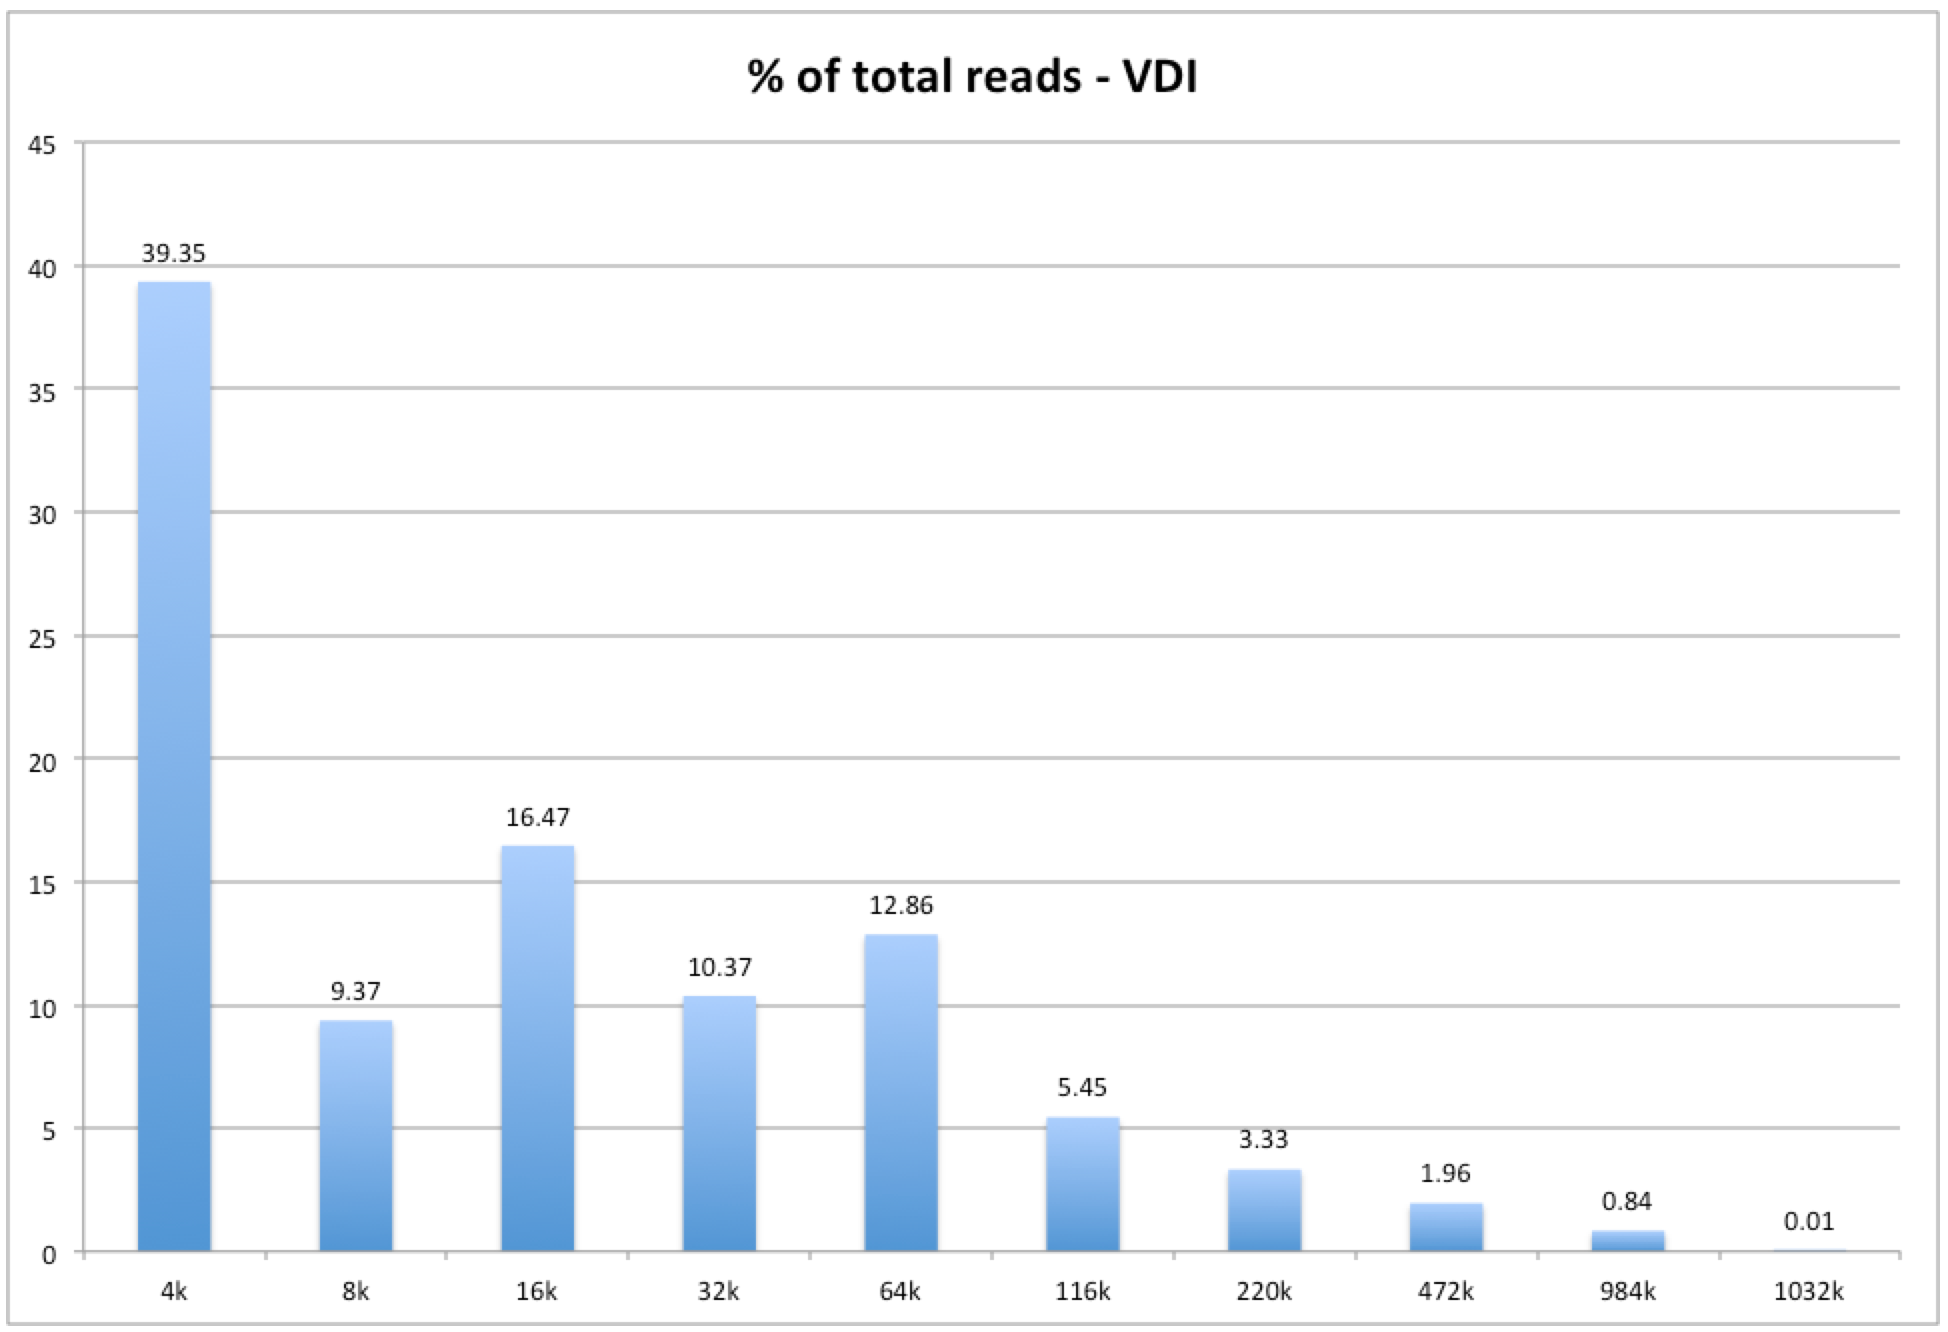
VDI – Read IO size mix
VDI – Write IO size mix

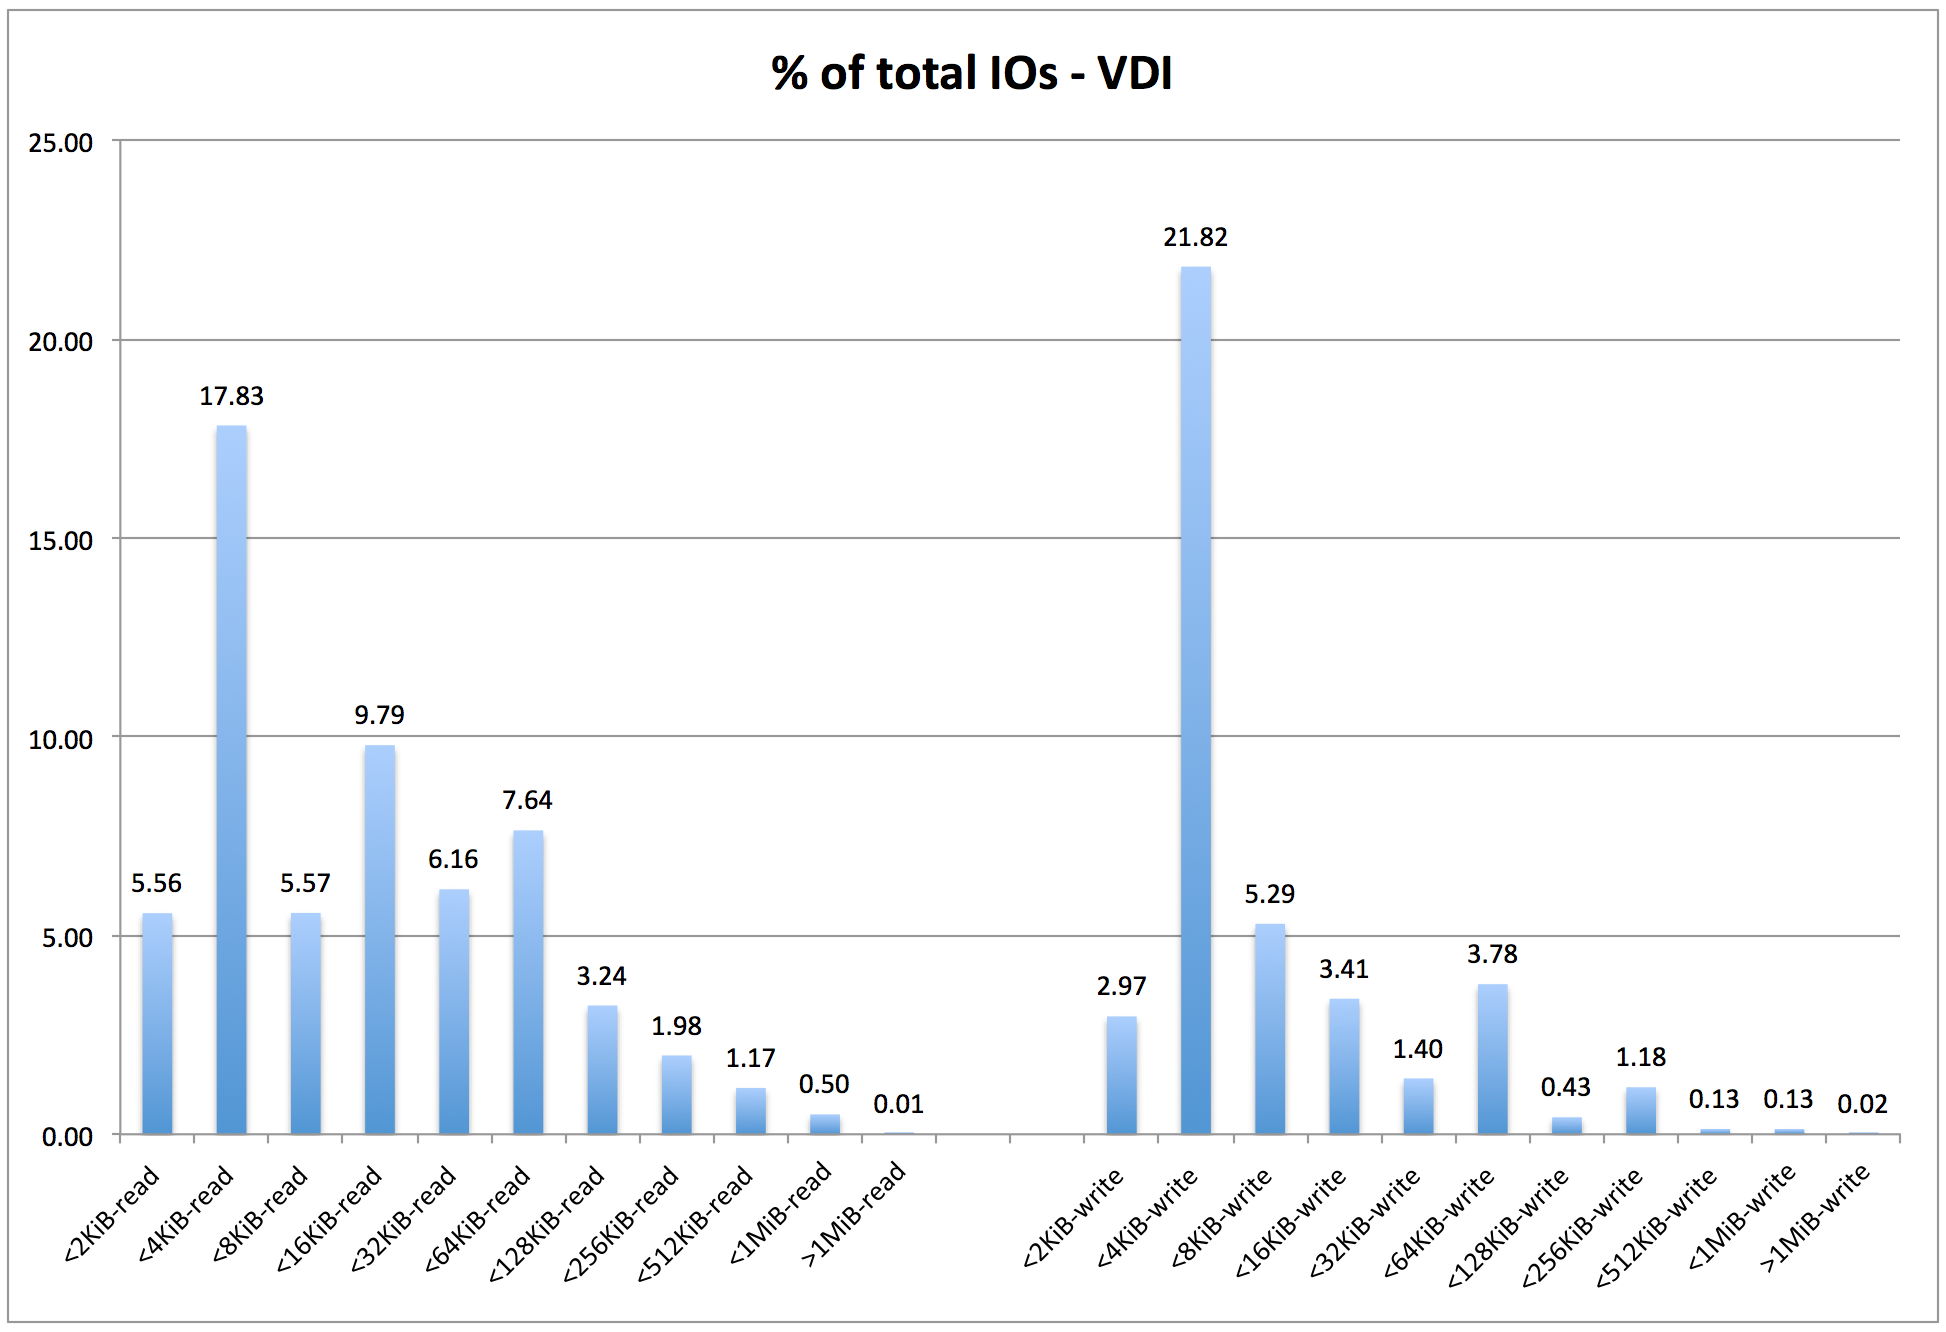
VDI – Percentage of Total IOs by IO Size
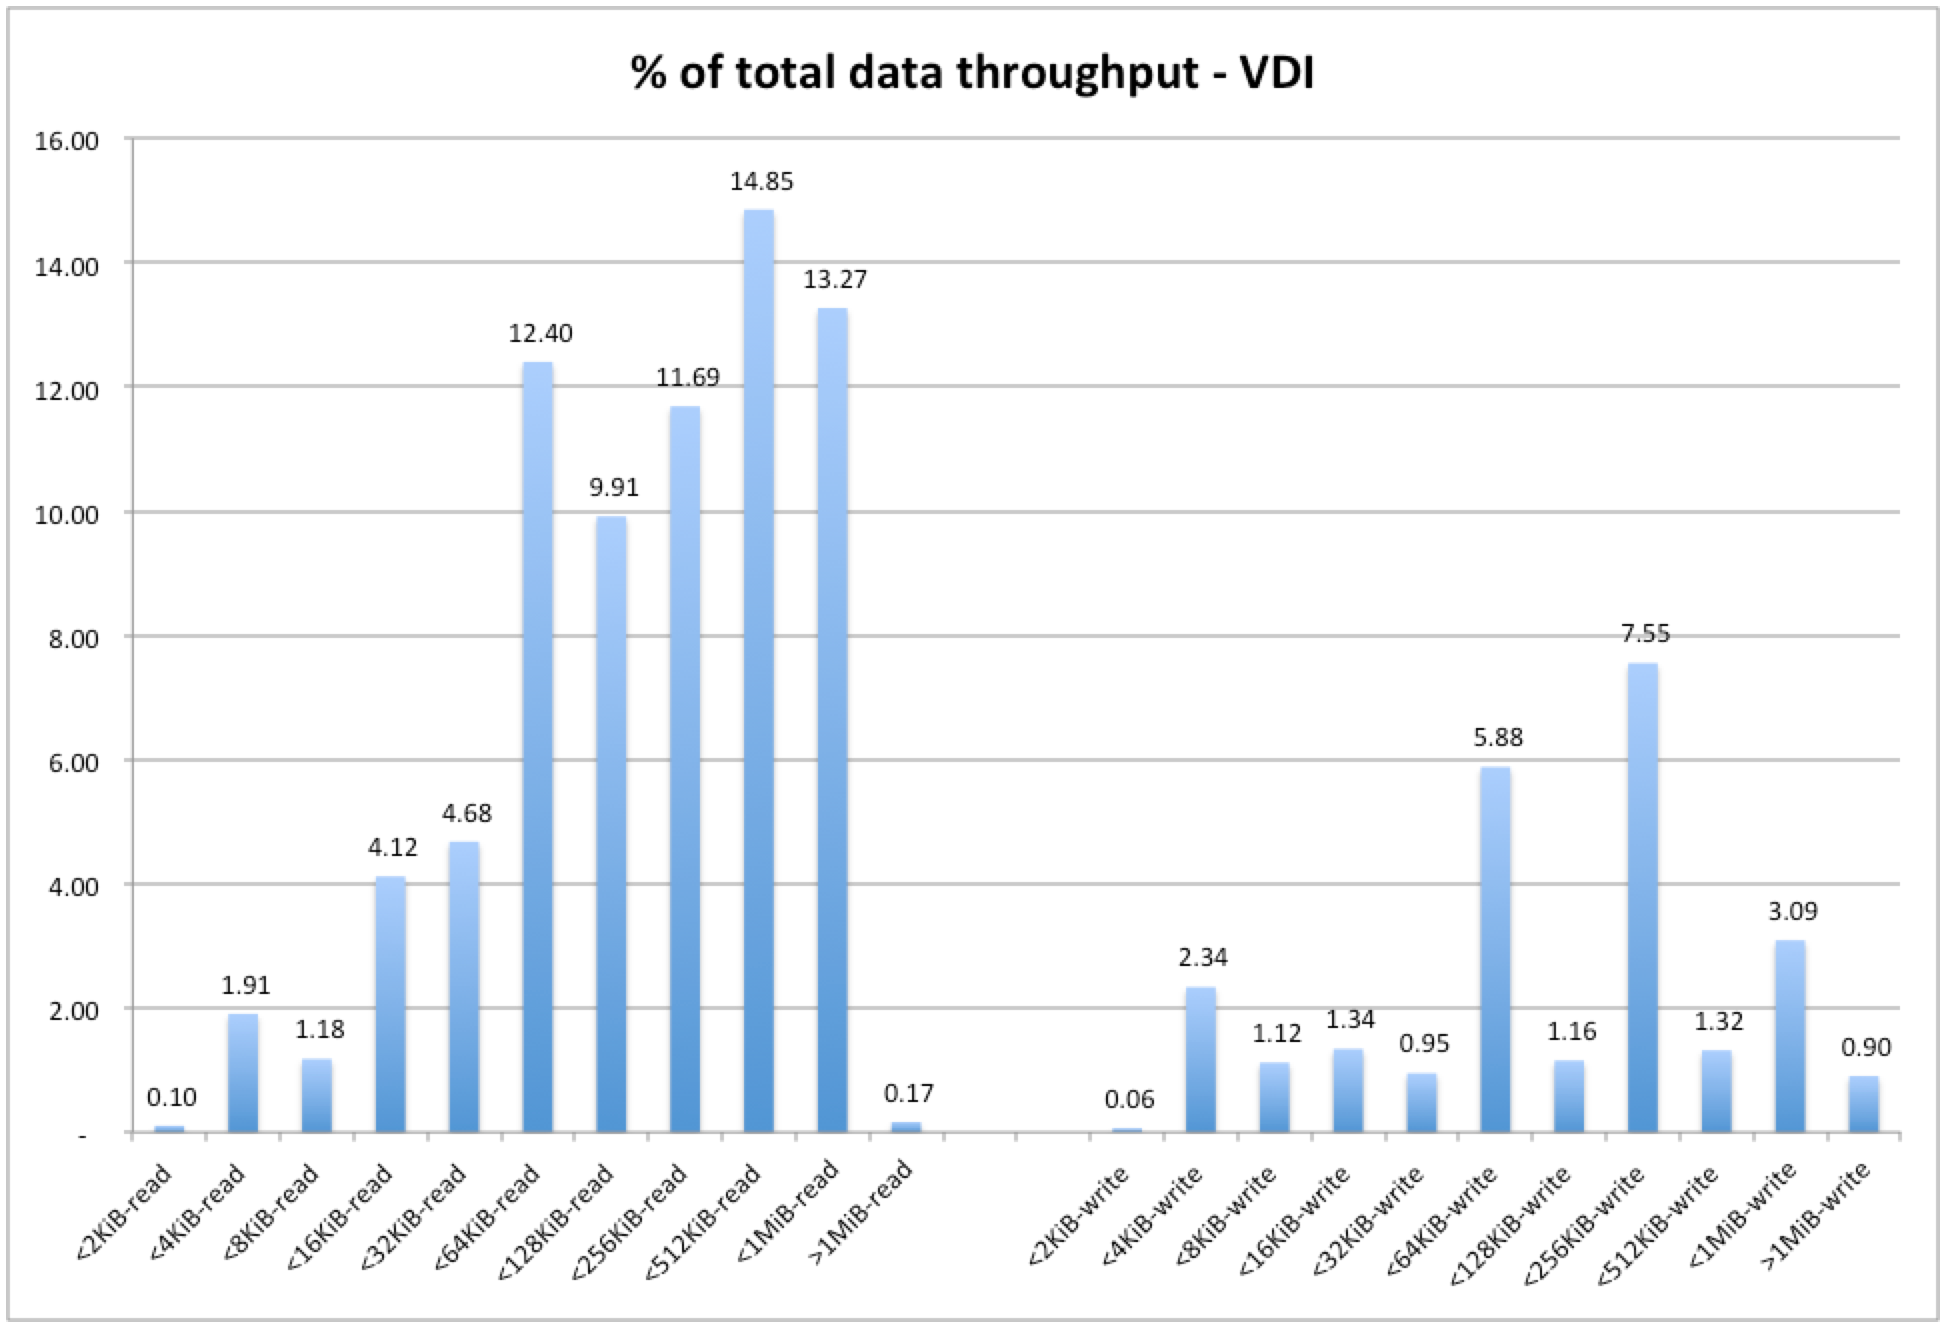
VDI – Percentage of Total Data Throughput by IO Size
==
dedupratio=2
dedupunit=4k
compratio=2
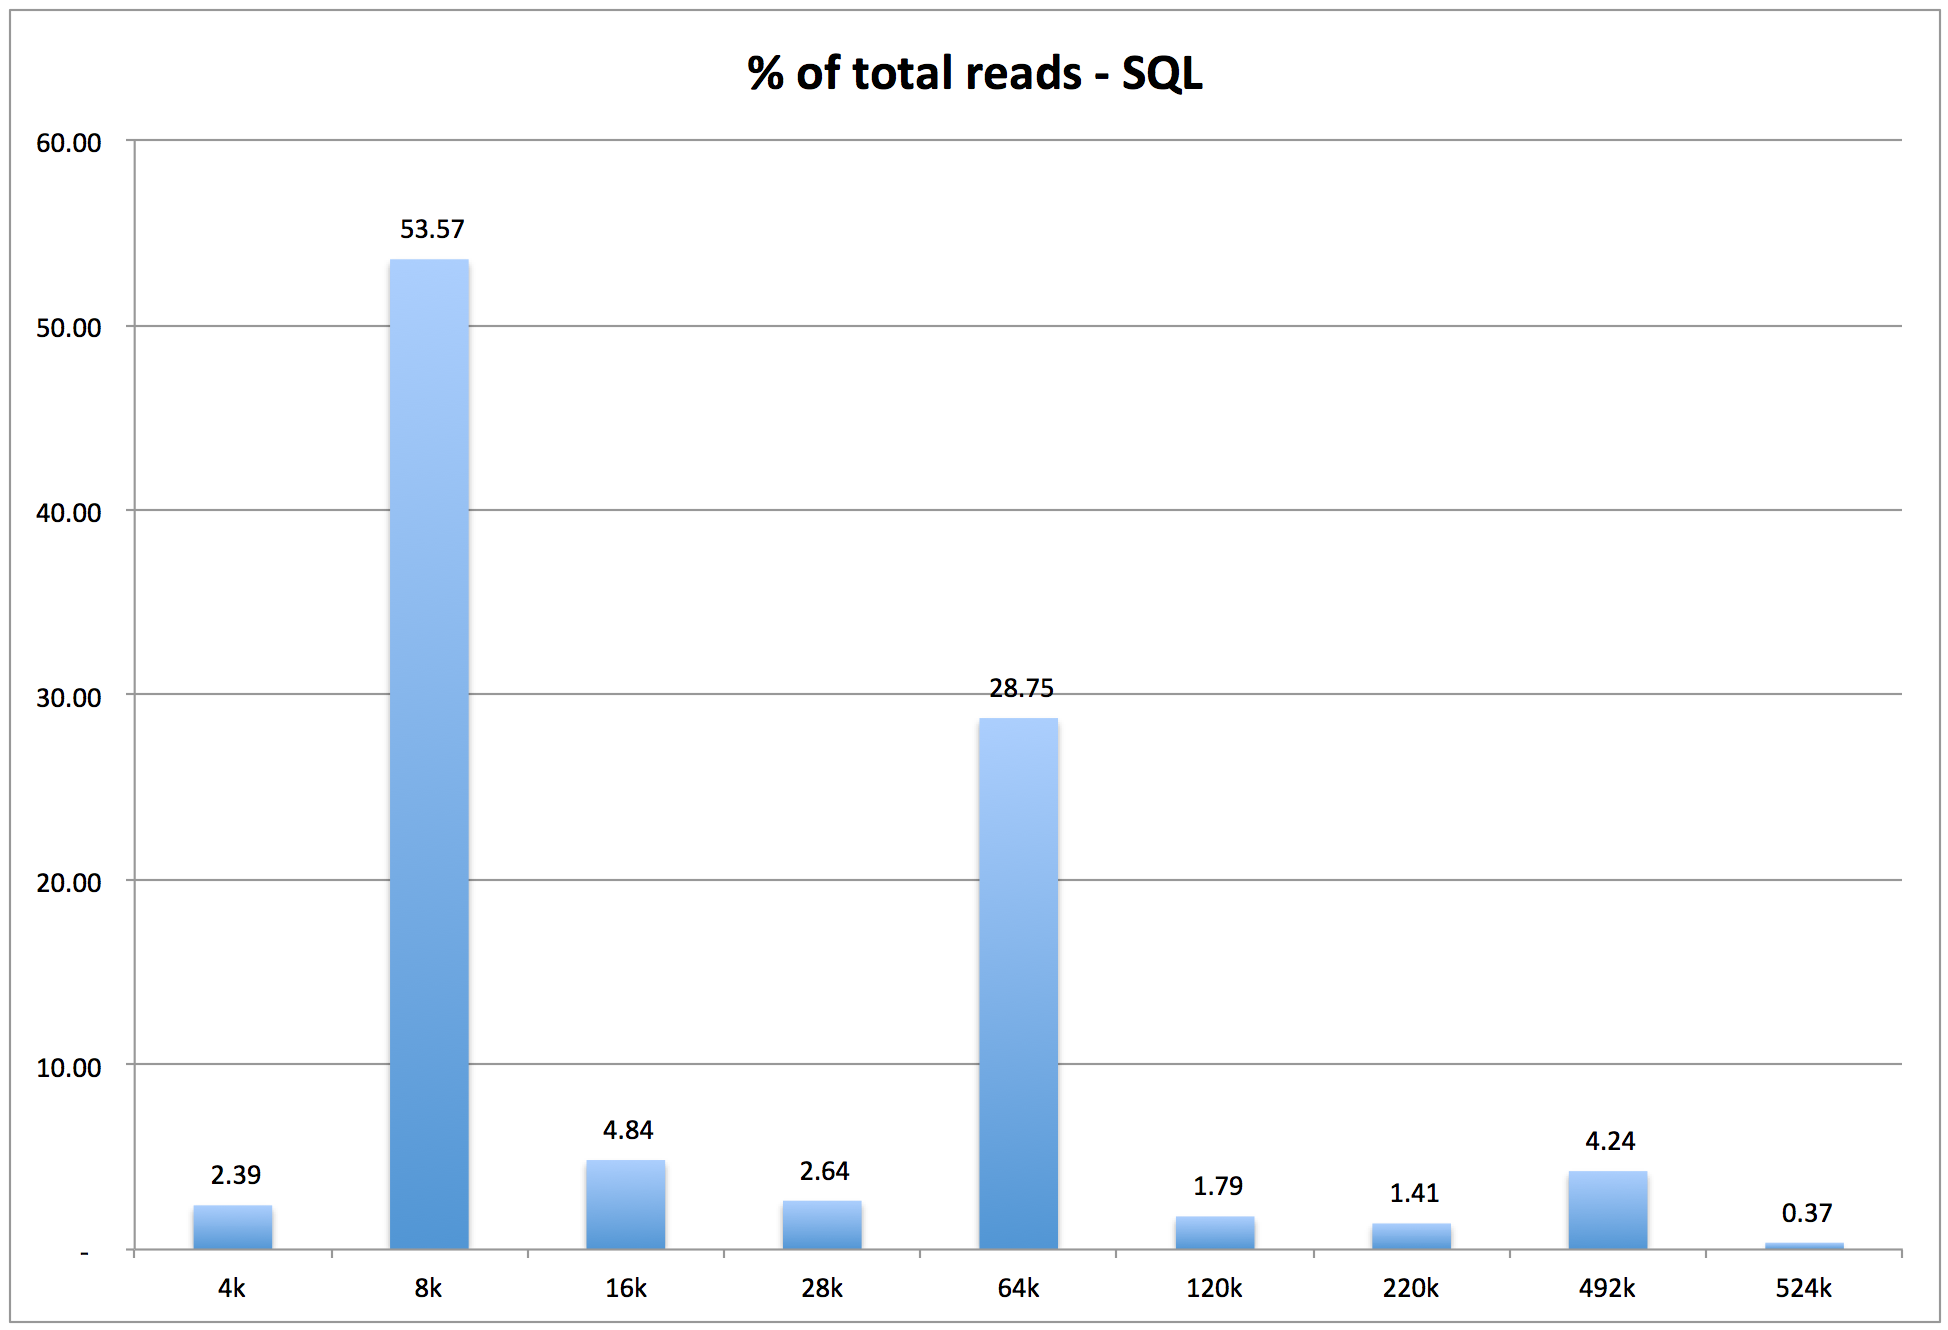
wd=wd_sql_read,rdpct=100,xfersize=(4k,2.39,8k,53.57,16k,4.84,28k,2.64,64k,28.75,120k,1.79,220k,1.41,492k,4.24,524k,0.37),seekpct=80,range=(0,100),sd=sd*
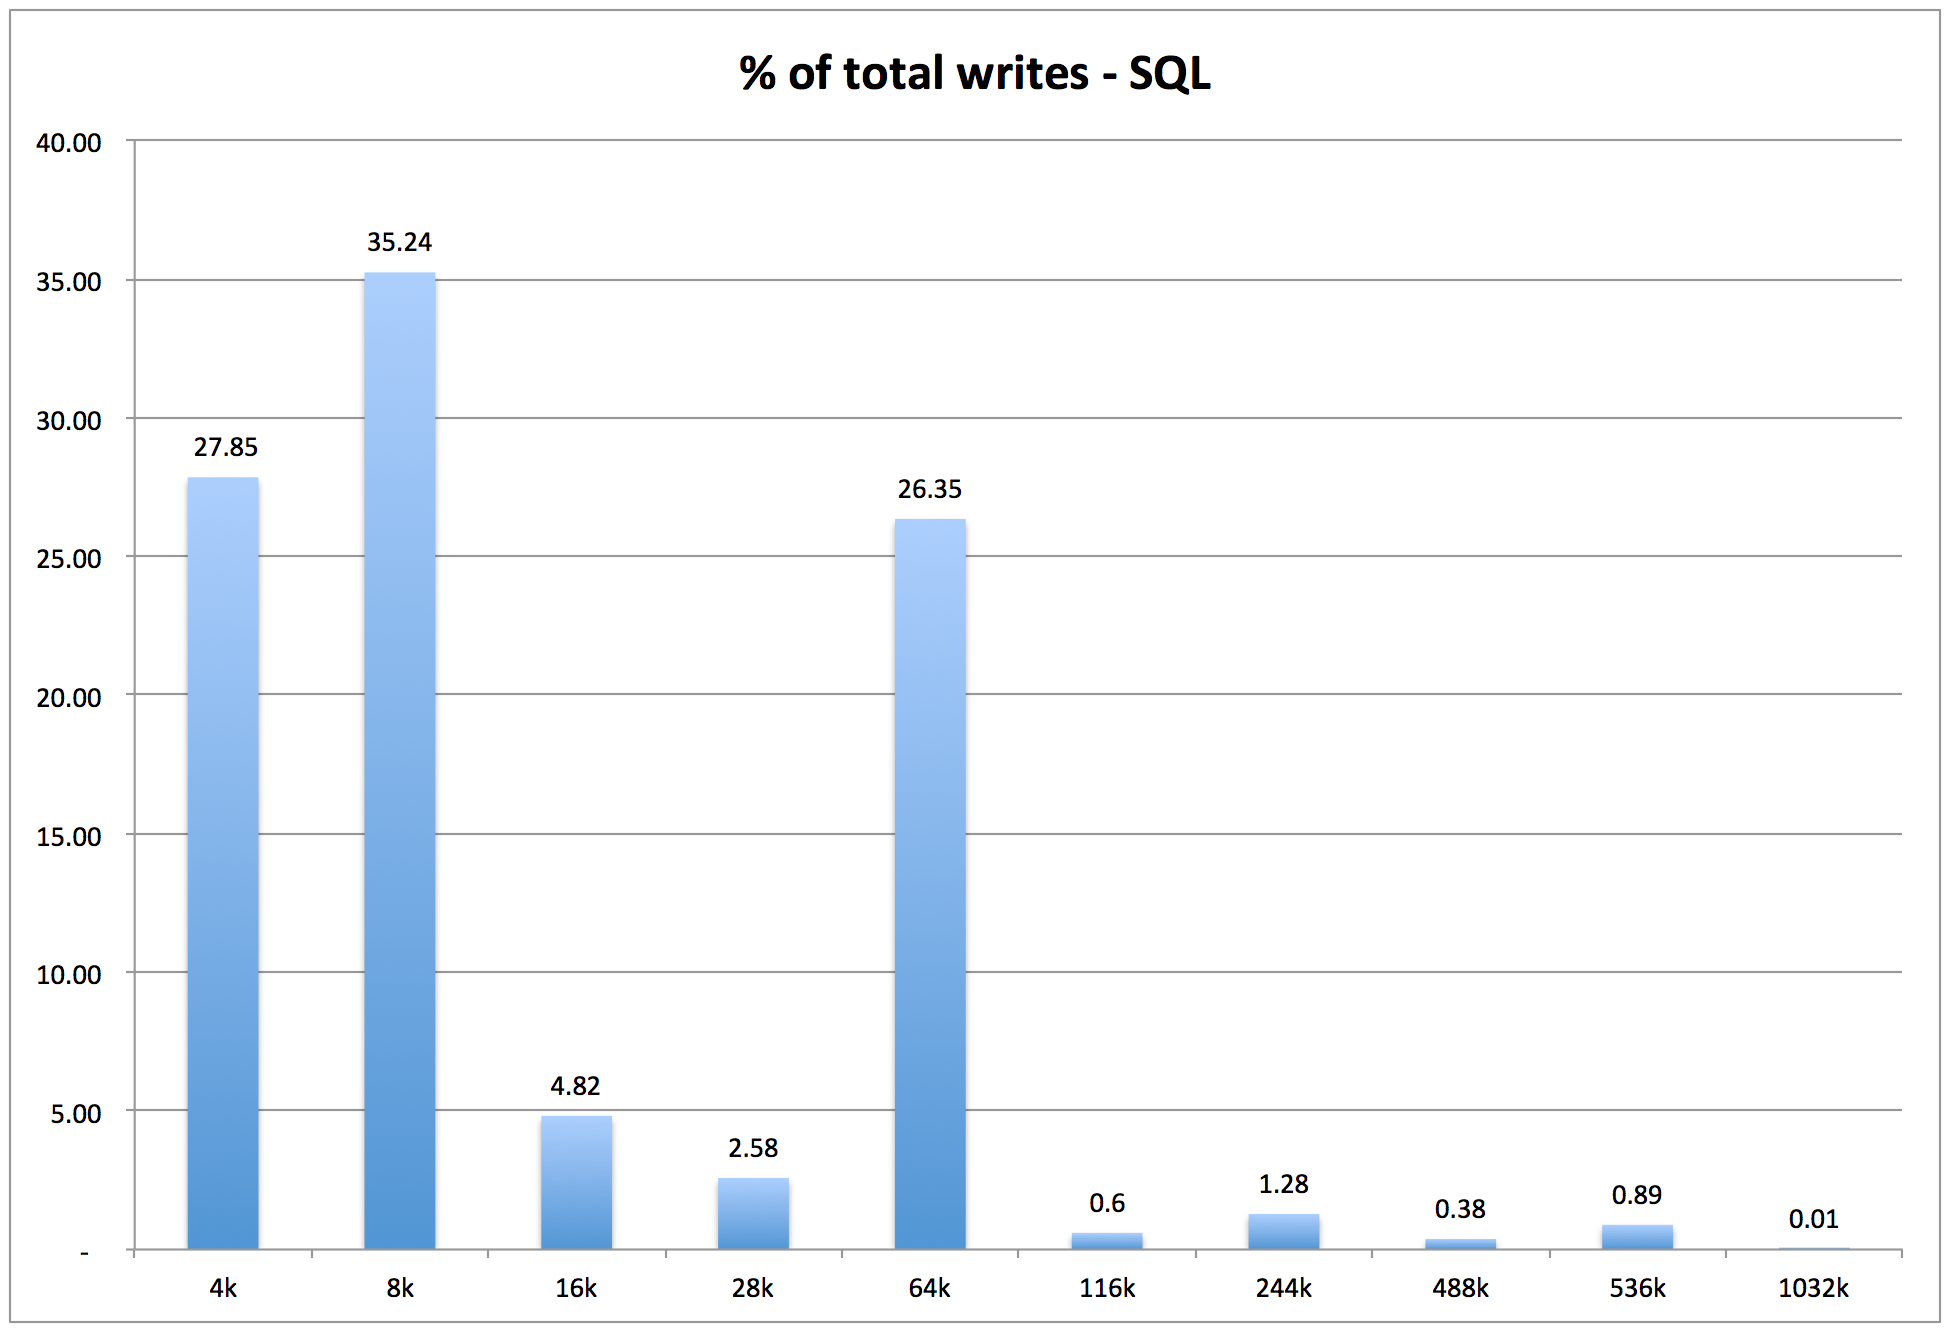
wd=wd_sql_write,rdpct=0,xfersize=(4k,27.85,8k,35.24,16k,4.82,28k,2.58,64k,26.35,116k,0.6,244k,1.28,488k,0.38,536k,0.89,1032k,0.01),seekpct=80,range=(50,100),sd=sd*
rd=rd_sql_ramp,wd=wd_sql*,forrdpct=68.42,curve=(20,35,50,65,80,90,92,94,96,98,99),iorate=curve,interval=1,elapsed=300,maxdata=999t,forthreads=16
SQL – Read IO size mix
SQL – Write IO size mix
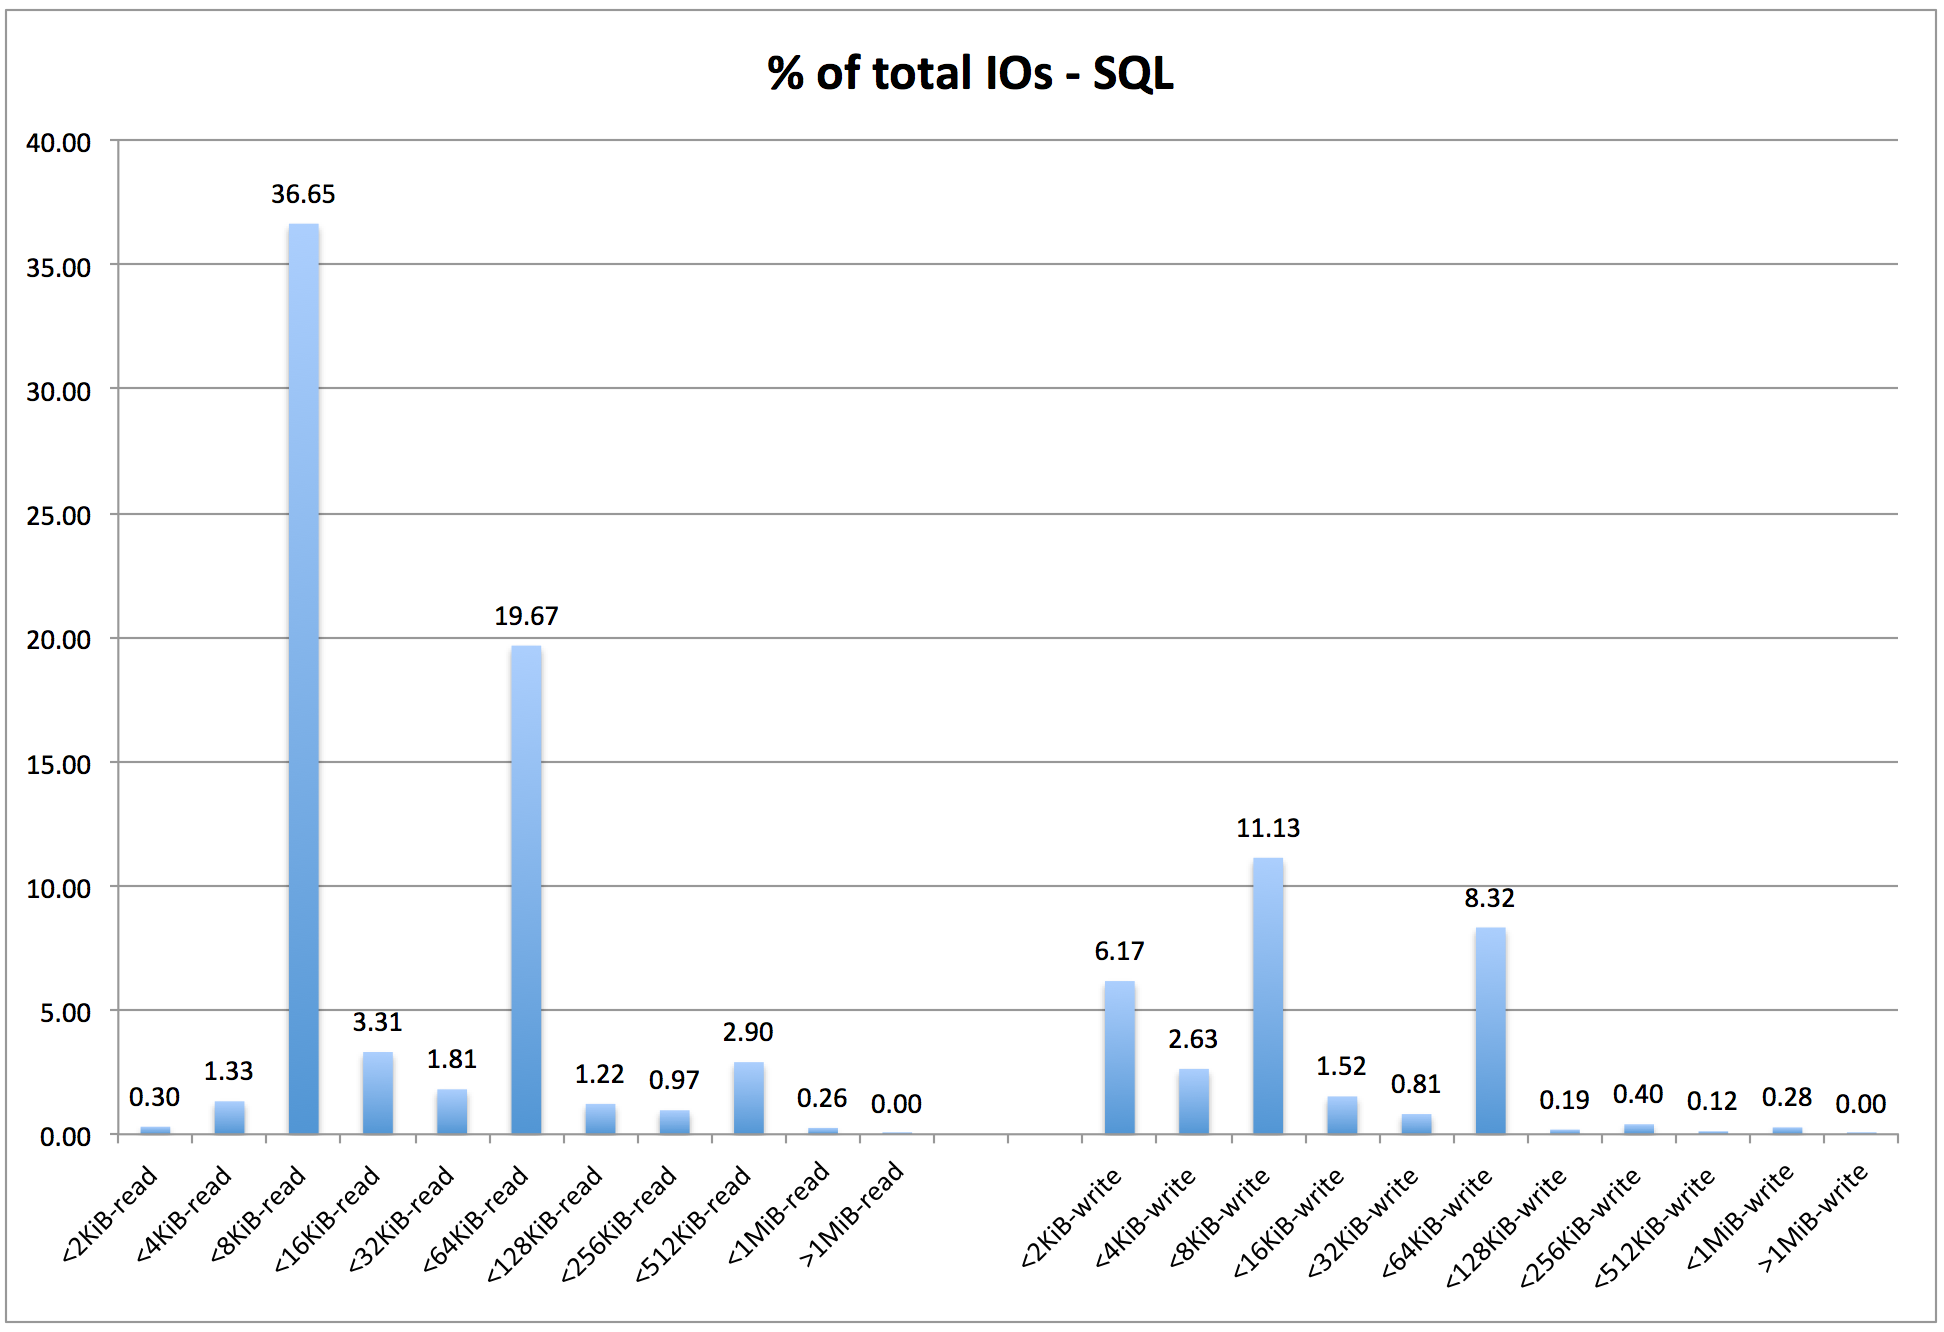
SQL – Percentage of Total IOs by IO Size
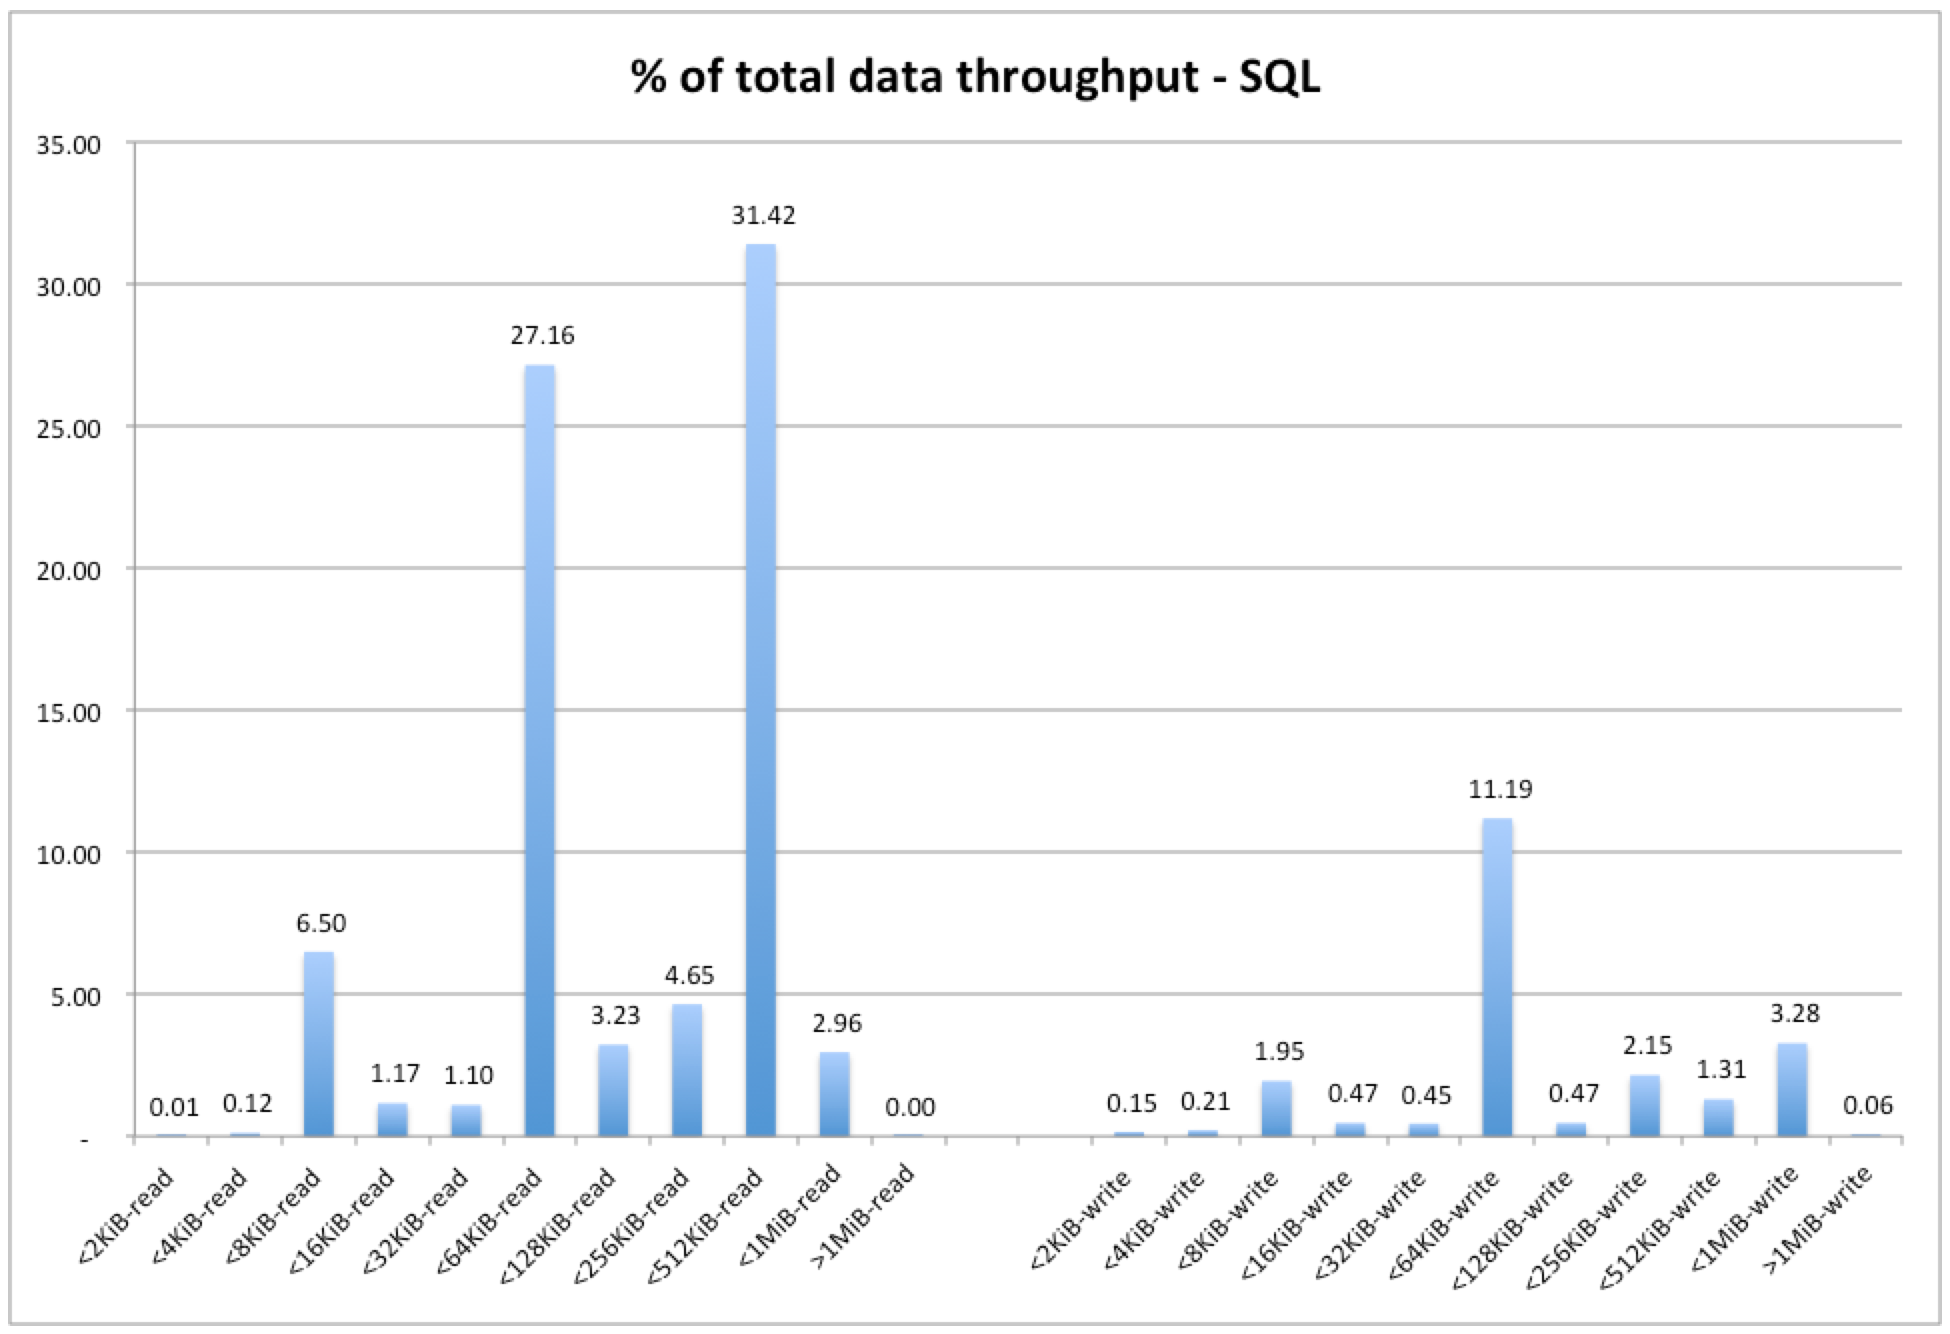
SQL – Percentage of Total Data Throughput by IO Size
==
dedupratio=3
dedupunit=4k
compratio=3
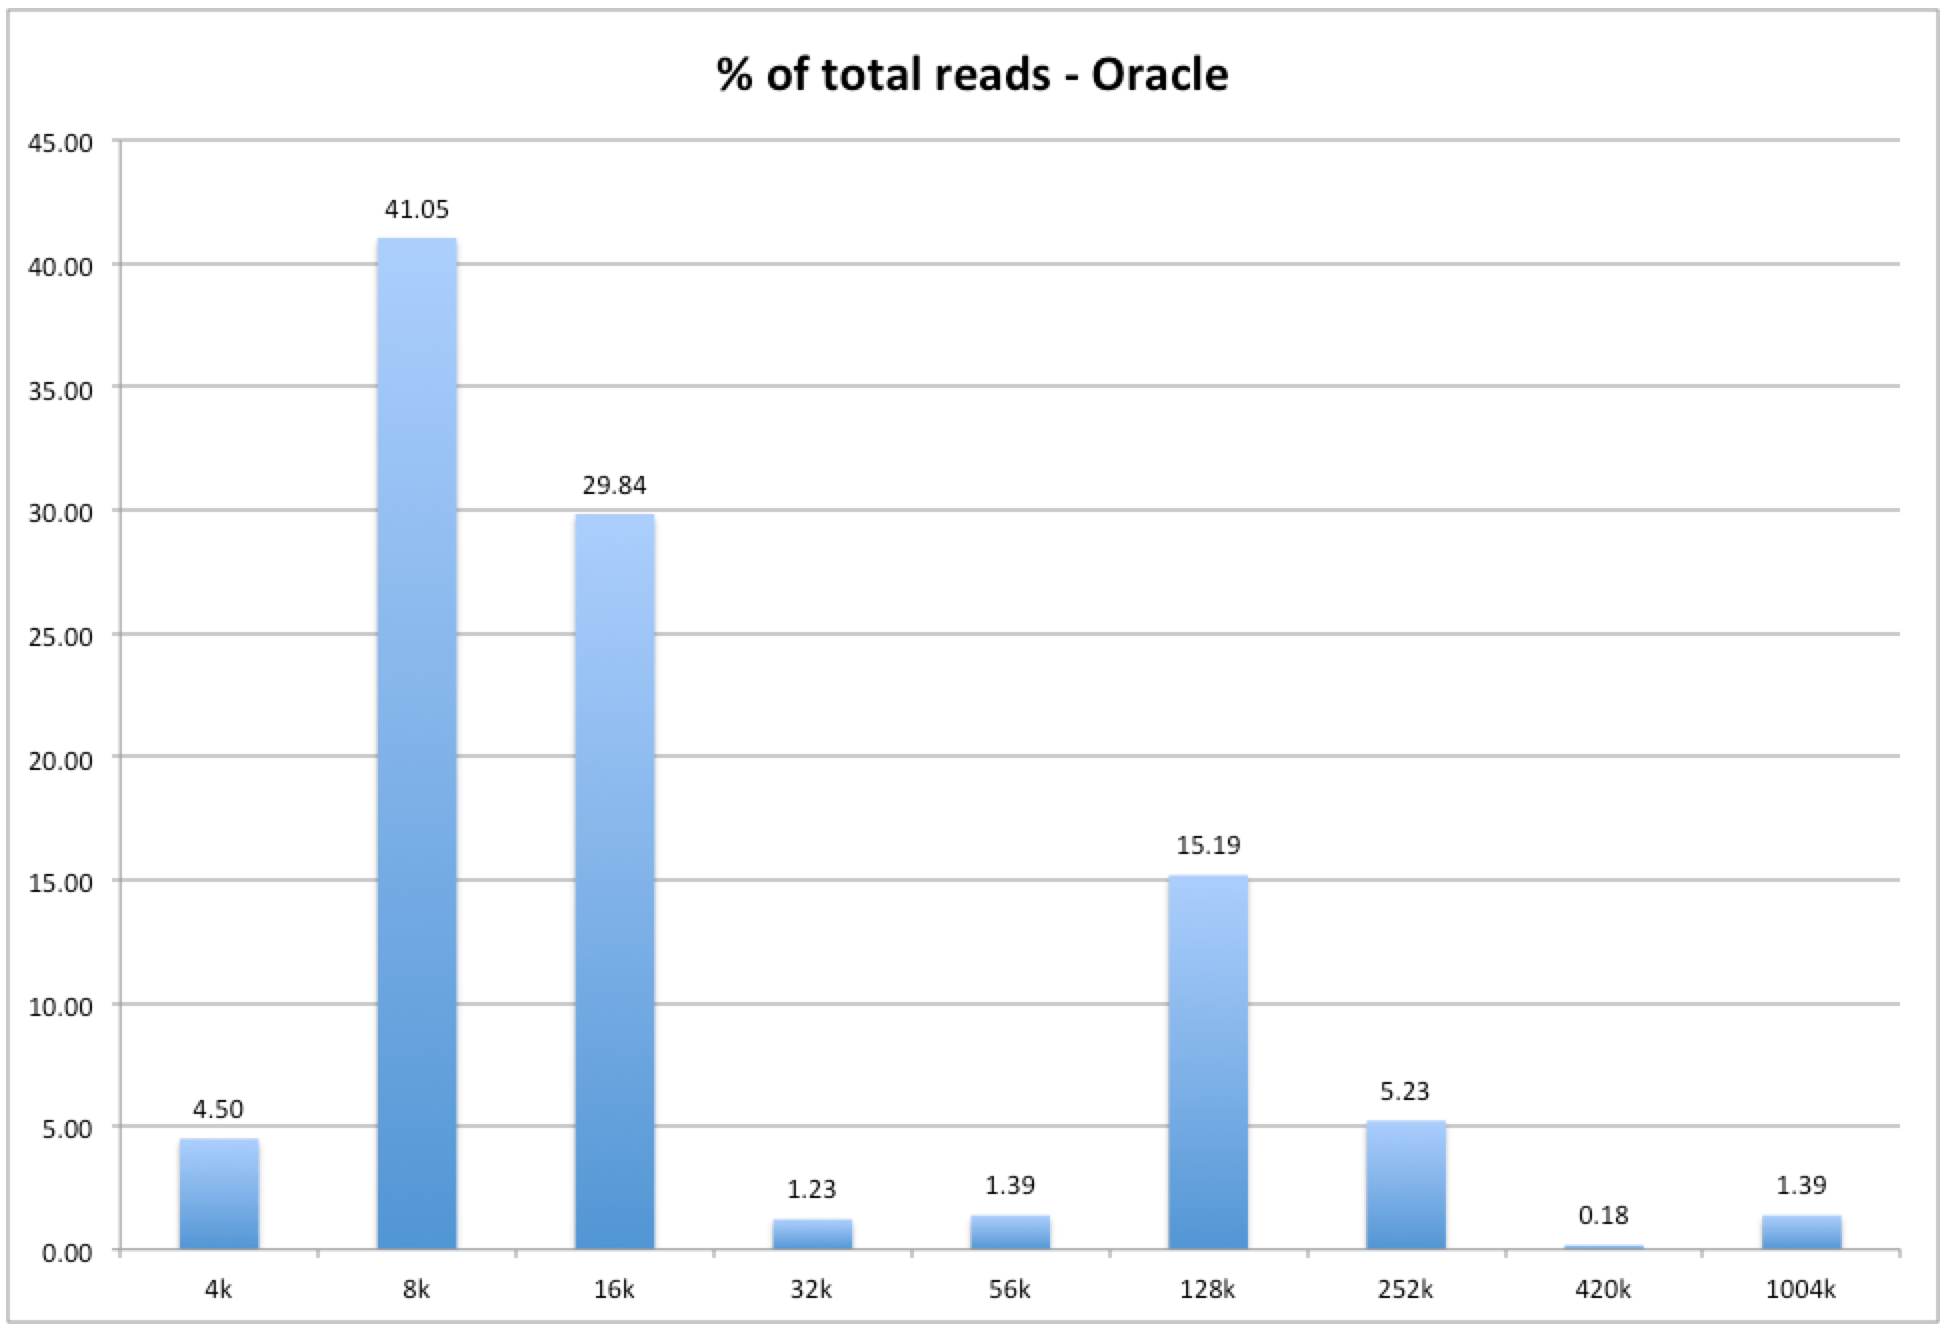
wd=wd_oracle_read,rdpct=100,xfersize=(4k,4.5,8k,41.05,16k,29.84,32k,1.23,56k,1.39,128k,15.19,252k,5.23,420k,0.18,1004k,1.39),seekpct=80,range=(0,100),sd=sd*
wd=wd_oracle_write,rdpct=0,xfersize=(4k,22.1,8k,37.3,16k,19.12,32k,5.35,56k,4.68,120k,7.65,236k,3.34,408k,0.15,944k,0.31),seekpct=80,range=(50,100),sd=sd*
rd=rd_oracle_ramp,wd=wd_oracle*,forrdpct=83.14,curve=(20,35,50,65,80,90,92,94,96,98,99),iorate=curve,interval=1,elapsed=300,maxdata=999t,forthreads=16
Oracle – Read IO size mix
Oracle – Write IO size mix

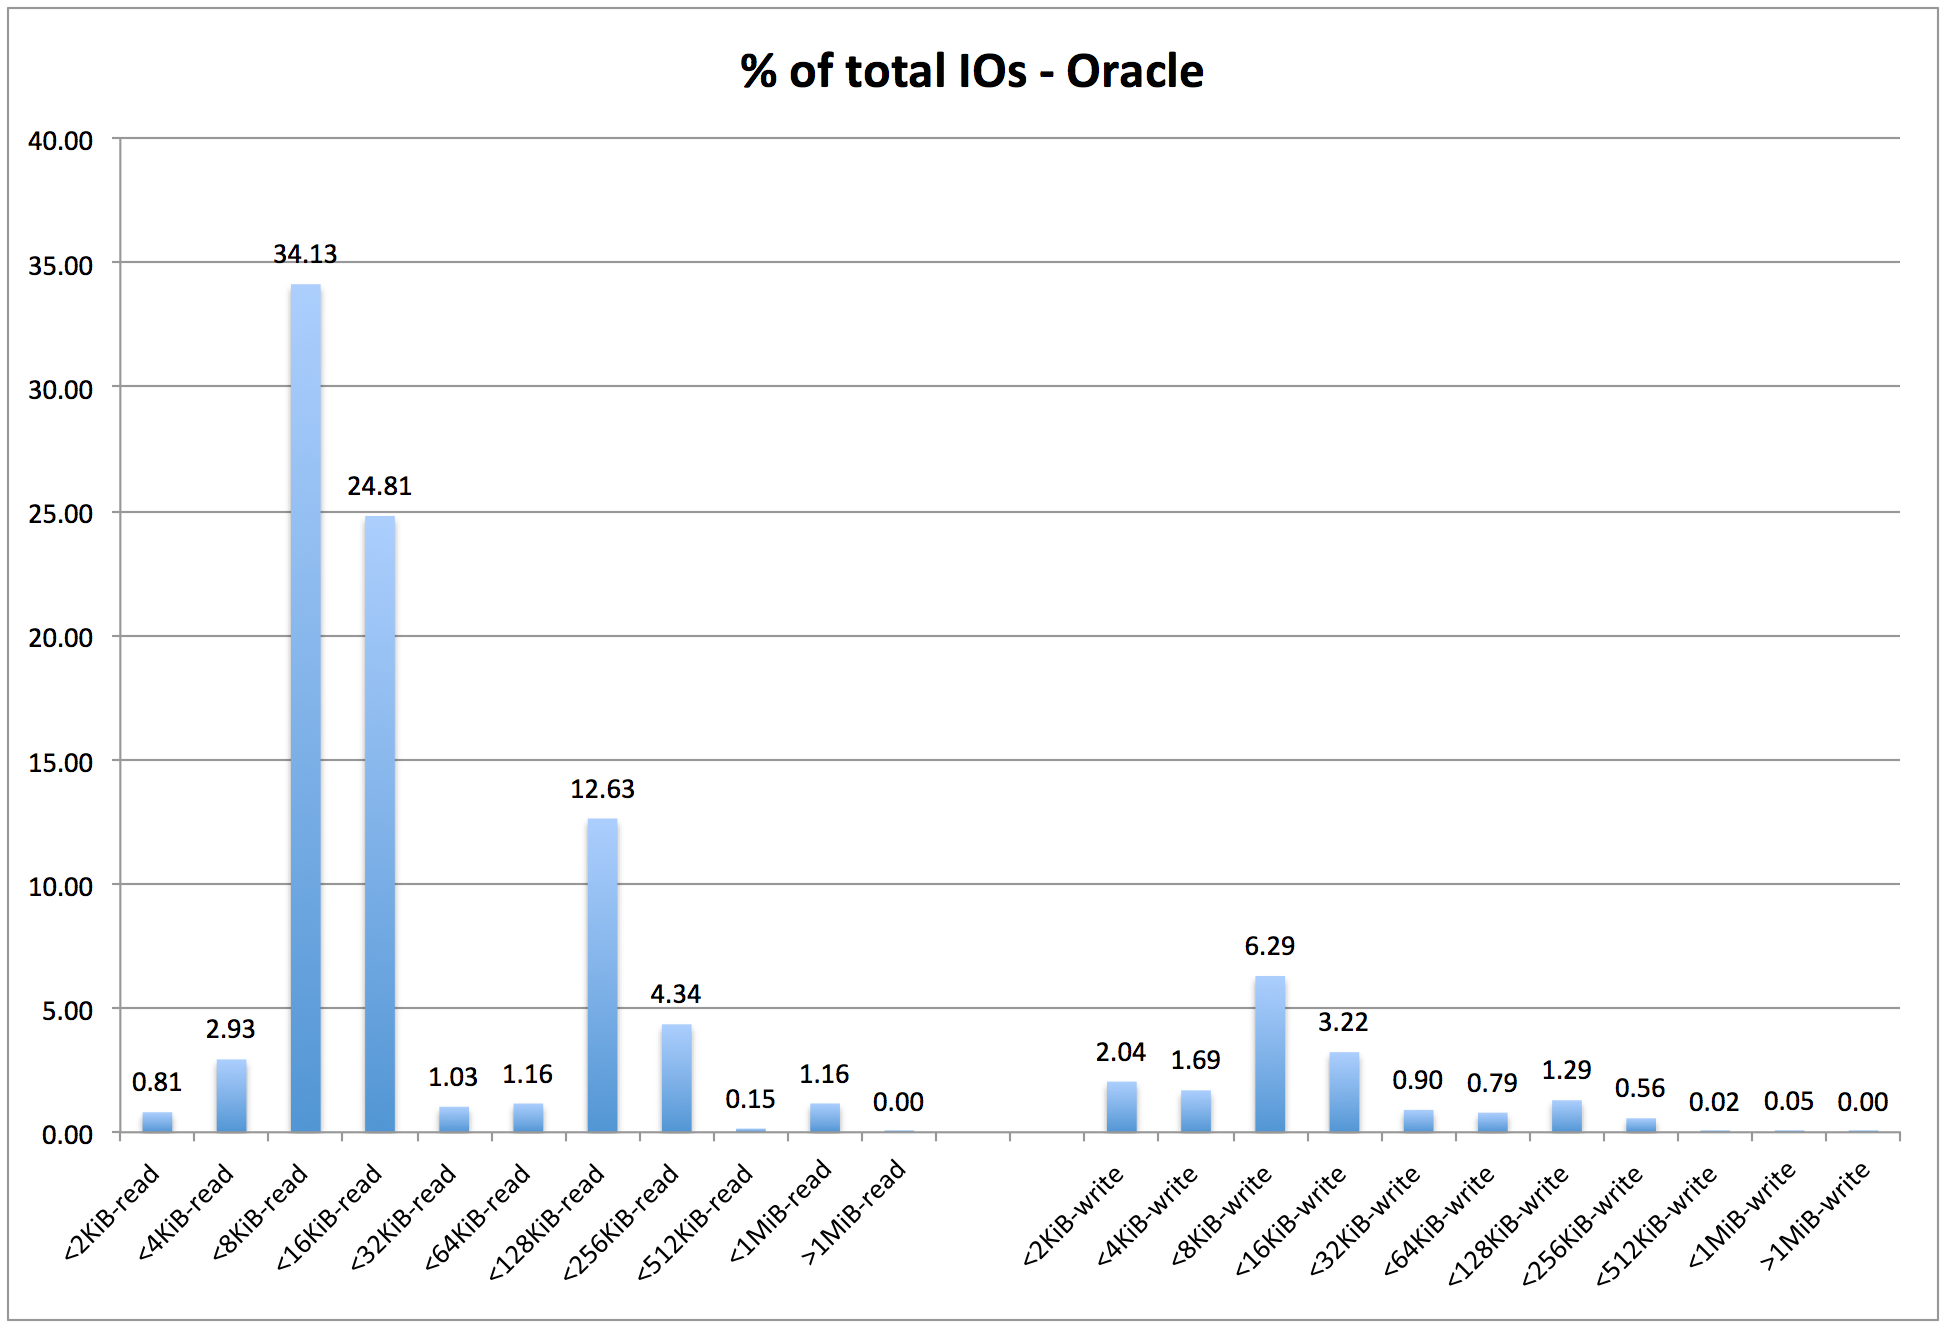
Oracle – Percentage of Total IOs by IO Size
Oracle – Percentage of Total Data Throughput by IO Size

Full examples of how to simplistically create synthetic models for these four workloads for use with Oracle’s vdbench tool can be found HERE.
Summary:
If it is decided that conducting a performance test with real-world applications is impractical, and synthetically modeling and scaling customer workloads is deemed necessary, the examples found in this blog post can be used as templates to help create composite workloads to test the performance of the storage array under test.