

This is the fourth post of a multi-part series by Bikash Choudhury and Emily Watkins, where we discuss how to configure a Kubernetes-based AI Data Hub for data scientists. See the previous posts in the series, Providing Data Science Environments with Kubernetes and FlashBlade, Storing a Private Docker Registry on FlashBlade S3, and Scraping FlashBlade Metrics Using a Prometheus Exporter.
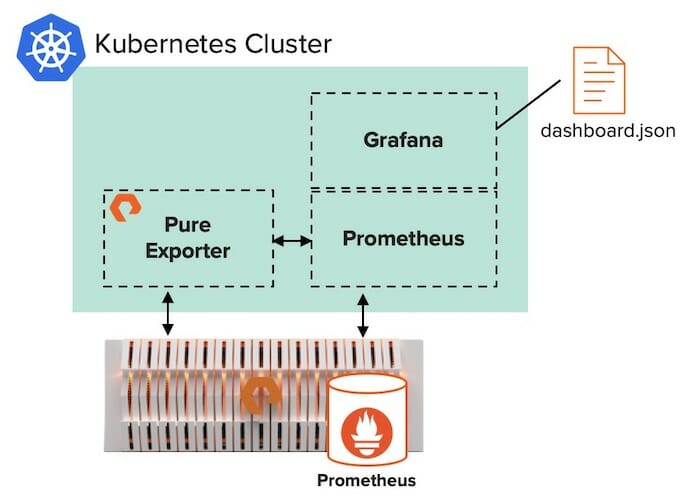
In the previous blog post in our series about ML pipelines, we discussed using the Pure Exporter to collect metrics from Pure Storage arrays and saving them to a Prometheus database.
Grafana provides great visualization for Prometheus databases. Adding Grafana to a Kubernetes cluster can be done in three easy steps, which we will dig into further in this post:
- Deploy Granfana in your Kubernetes cluster.
- Create a dashboard in Grafana.
- Make your new dashboard persistent for all users in your cluster.
Step 1: Deploy Grafana in your Kubernetes Cluster
For this example deployment, we use Rancher as the cluster orchestration platform. Rancher simplifies management of Kubernetes clusters–especially for teams managing multiple clusters.
In order to use FlashBlade™ as the storage, we created a storage class named “pure-file” in our Kubernetes cluster. That storage class uses the Pure Service OrchestratorTM (PSO) to seamlessly auto-provision persistent volumes on FlashBlade as needed.
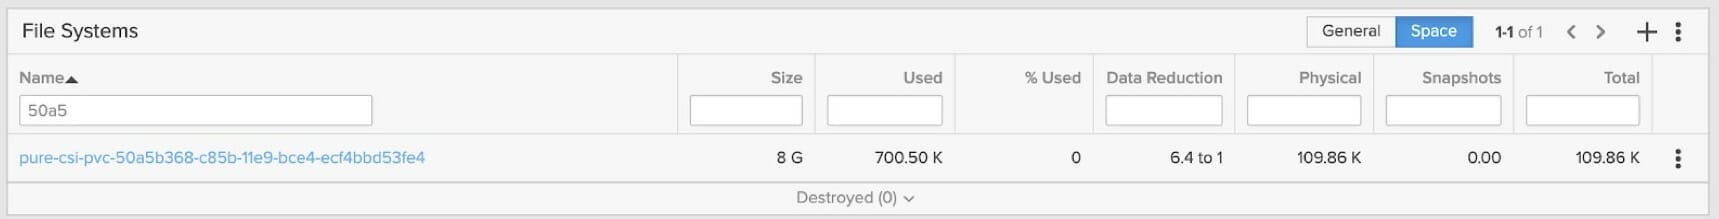
Persistent storage eliminates the possibility of destroying the data when the services are restarted. Using FlashBlade as persistent storage for Prometheus and Grafana can also provide data reduction. For example, our Grafana database is currently getting 6.4:1 data reduction.
For instructions on deploying a Rancher-based Kubernetes cluster using PSO on FlashBlade, please see our joint white paper with Rancher.
Then, it’s easy to add Prometheus to a Rancher-based Kubernetes cluster with these quick steps. During the Prometheus installation, Rancher allows users to deploy Grafana from the same window.
Step 2: Create a Dashboard in Grafana
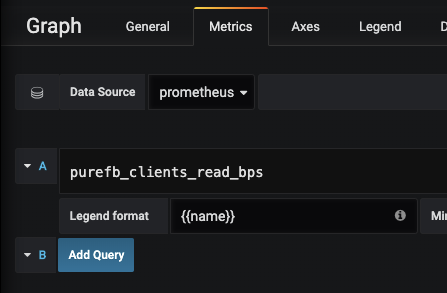
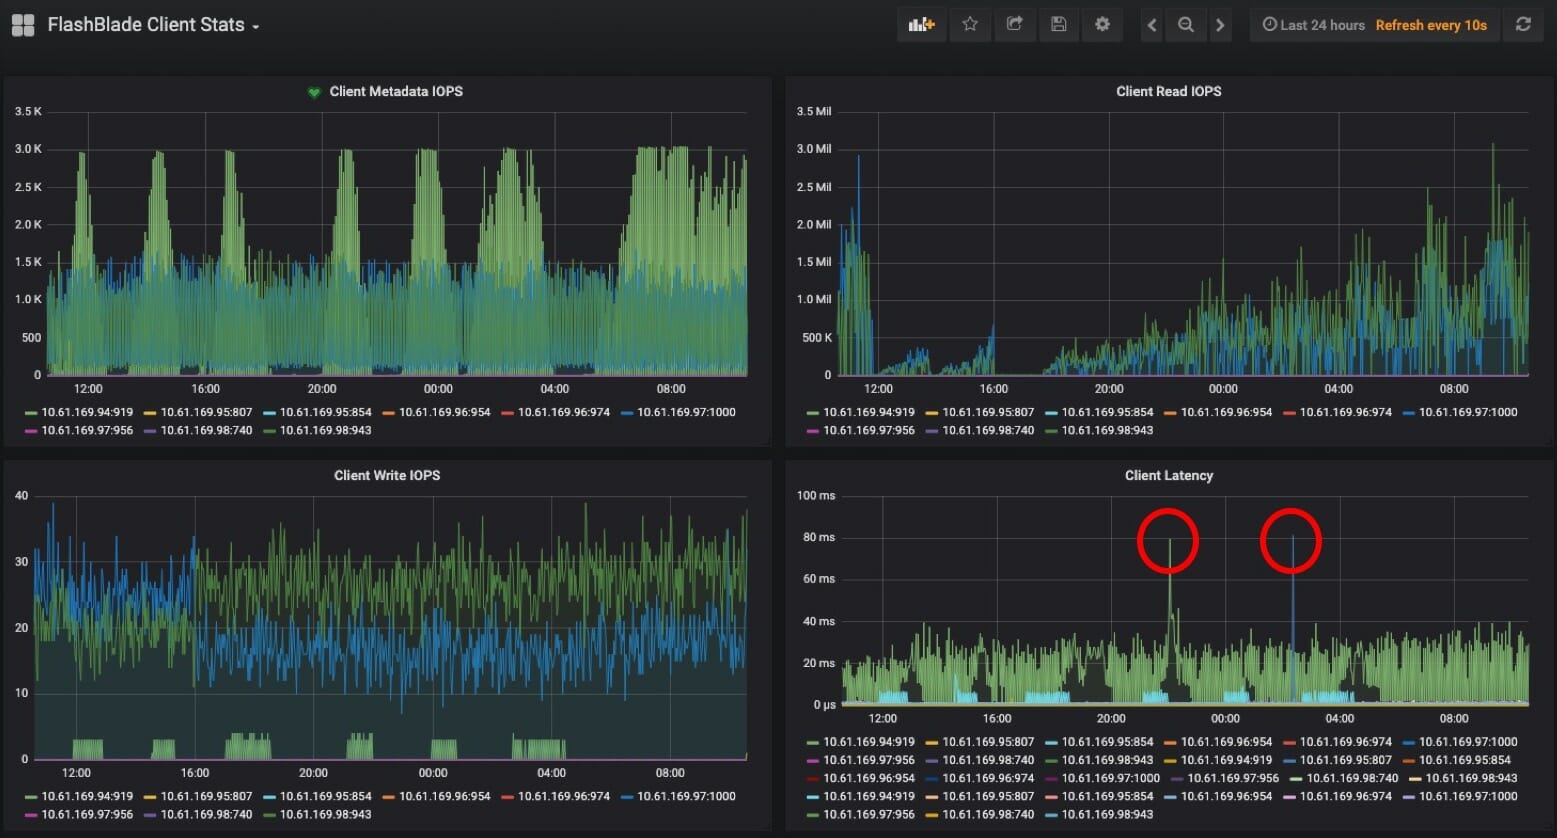
In the previous blog post, we discussed how to monitor per-client stats on a FlashBlade array. Now, we can create a “FlashBlade Client Stats” dashboard to visualize those metrics.
When building a new dashboard, after adding a new panel and selecting “Graph” type, using the new Prometheus metrics is as easy as specifying “Data Source: prometheus” and selecting the new metric.
Here’s an example of a finished dashboard we can use to visualize client statistics across our ML workloads:
Here are some helpful resources for learning more about creating Granfana dashboards and alerts:
- Grafana Getting Started Guide
- Hosted Graphite Grafana Dashboards
- IBM Cloud Configuring Alerts in Grafana
Step 3: Make your Dashboard Persistent
While users may have editing privileges in Grafana to create new dashboards, it’s necessary to move a new dashboard into the Kubernetes configuration in order to make it available for every Grafana user in the cluster.
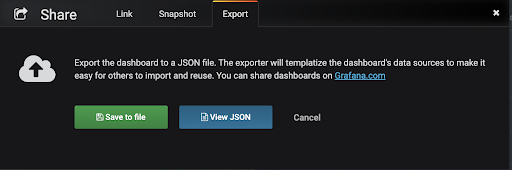
Export the dashboard’s configuration file (JSON).
![]()
The “Share” menu will move to the sub-menu, where the “Export” tab provides the option to save the JSON configuration as a file.
After exporting from Grafana, our client-stats-dashboard.json file looks something like this:
|
1 2 3 4 5 6 7 8 9 10 11 12 13 |
"annotations": {...}, … "panels": [ {<<...panel...>>}, {<<...panel...>>}, {<<...panel...>>}, {<<...panel...>>} ] … "title": "FlashBlade Client Stats", "uid": "wPsYtu-Wk", "version": 3 } |
The full JSON is much longer, but we just wanted to show the rough shape of it here because we’ll need to make a slight change to it before adding it to your cluster’s Grafana config map.
Since the Grafana config map saves information both for dashboards and for data sources, we need to add a prefix and suffix to our JSON to identify it as a dashboard.
|
1 2 3 4 5 6 7 8 9 10 11 12 13 14 15 16 17 18 19 20 21 22 23 24 25 26 27 28 29 30 31 32 33 34 35 36 37 38 39 40 41 42 43 44 45 46 47 48 49 50 51 52 53 54 55 |
{ "dashboard":{ "__inputs":[ { "name":"DS_PROMETHEUS", "label":"prometheus", "description":"", "type":"datasource", "pluginId":"prometheus", "pluginName":"Prometheus" } ], "__requires":[ { "type":"grafana", "id":"grafana", "name":"Grafana", "version":"5.0.0" }, { "type":"panel", "id":"graph", "name":"Graph", "version":"5.0.0" }, { "type":"datasource", "id":"prometheus", "name":"Prometheus", "version":"5.0.0" } ], "annotations": {...}, … "panels": [ {<<...panel...>>}, {<<...panel...>>}, {<<...panel...>>}, {<<...panel...>>} ] … "title": "FlashBlade Client Stats", "uid": "wPsYtu-Wk", "version": 3 }, "inputs": [ { "name": "DS_PROMETHEUS", "pluginId": "prometheus", "type": "datasource", "value": "prometheus" } ], "overwrite": true } |
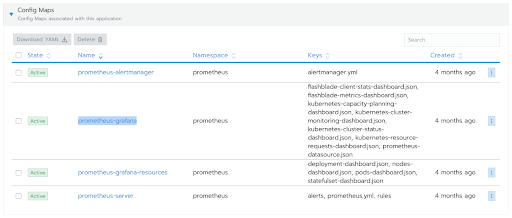
Now we can add your dashboard’s JSON file to your cluster’s Grafana config map.
This client-stats-dashboard.json was added the configmap for Grafana in the Kubernetes cluster.
Because we deployed Prometheus via the app catalog, we have several auto-generated config maps for Prometheus, including one named “prometheus-grafana”.
Adding our new dashboard is as simple as adding a key-value entry.
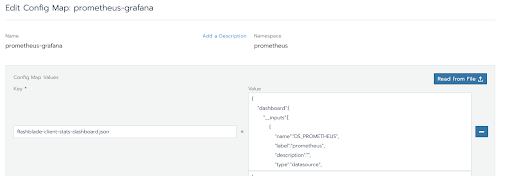
NOTE: because the config map describes both dashboards and datasources, the new dashboard’s key needs to end in “-dashboard.json”.
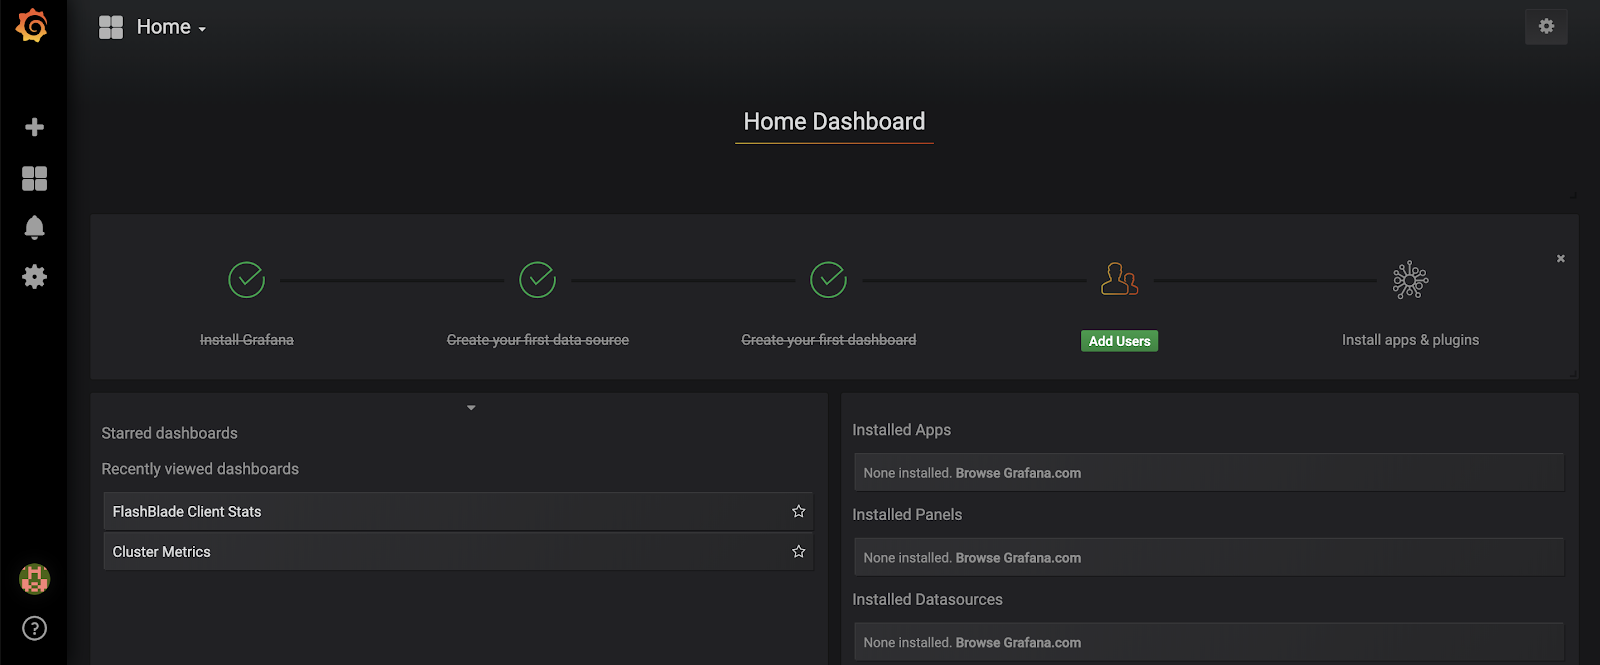
After we re-deploy the prometheus-grafana service, the “FlashBlade Client Stats” dashboard is now available for all cluster users who access our Grafana server.
Takeaways
Deploying Grafana in your Kubernetes cluster is extremely simple now that Pure Service Orchestrator allows you to quickly provision persistent storage. It’s easy to create new dashboards on the fly and then make them available to all users.
Come back to the blog for the next posts in the series over the coming weeks:
- Automating an inference pipeline in a Kubernetes Cluster
- Tuning networking configuration of a Kubernetes-based AI Data Hub
- Integrating Pure RapidFile Toolkit into Jupyter notebooks