

In a previous post, I wrote about the benefits of configuring Prometheus and Grafana on Pure Storage®. However, a single instance of Prometheus still has some disadvantages. Let’ s talk about scaling Prometheus. For example:
- Every Prometheus server requires multiple Grafana instances. Each Prometheus server scrapes its own list of endpoints or targets and serves as the data source to Grafana for visualization. There’s no way to merge the time series data from different Prometheus servers.
- The retention time of a single Prometheus server is limited. It can’t store and retain time series data long- term for months or years.
- When a Prometheus server crashes, queries lose some data until it comes back online.
Just like Prometheus, Thanos is project currently in incubation with Cloud Native Computing Foundation (CNCF). Thanos runs as a sidecar in the Prometheus server and comprises multiple components like query, store gateway, compact, and ruler. These components give Prometheus the ability to have a highly available metrics system with long-term storage capabilities.
Pure FlashBlade® provides a unified fast file and object (UFFO) platform that supports network file system (NFSv3/v4.1), server message block (SMBv2.1/3.0), and S3-compatible object storage on the same platform. Storing the Prometheus database (promdb) and various components of Thanos on FlashBlade provides the capacity scaling for longer data retention times with better data reduction using a hybrid architecture with NFSv3 and S3-compatible object store for promdb and long-term data retention back-end storage respectively.

Figure 1: Prometheus with Thanos and Grafana on FlashBlade architectural layout
As shown in Figure 1, each Prometheus server is padded with Thanos sidecar. It extends new functionalities like global view from a single Grafana visualization tool where the promql queries are merged and time series data from different Prometheus servers, also known as replicas, are aggregated.
Key Thanos Components
Sidecar: This the core Thanos component that runs alongside Prometheus. The sidecar reads and writes the time series data to the object store configured on FlashBlade. The initial time series data is stored in the respective promdb hosted on FlashBlade over NFS for two hours (tuneable) before it’s moved to the back-end object store. The sidecar also functions as an interconnect to a central query layer between different Prometheus servers.
Store or store gateway: The Prometheus server or replicas write the in-memory data to the respective promdb every two hours. After two hours, the store gateway uses the StoreAPI to translate the data format from blocks to objects and writes to the object store bucket on FlashBlade. The store gateway also indexes the time series data and caches the most frequently queried indexed blocks for faster response. The store, along with promdb, is configured on FlashBlade over NFS to provide thin-provisioned storage that offers elasticity for the cache size for the indexed blocks for better performance.
Compact or compactor: The sidecar uploads the time series or metrics data to the compactor using the StoreAPI to write to the object store bucket on FlashBlade. It’s responsible for aggregating or compacting the indexed data before writing to the object store bucket. The compactor is also responsible for downsampling the large metrics data sets into downsampled chunks. Further validation indicates that the object store configured on FlashBlade reduces the historical data footprint in the bucket with a compression up to 4:1 as shown in the diagram below.
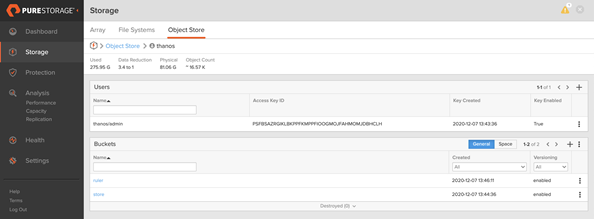
Figure 2: Data reduction for store and ruler buckets on FlashBlade
Rule or ruler: The ruler consolidates the rules and condition-based alerts in one location. It reduces the complexity, latency, and per-alert costs from single Prometheus servers. We recommend configuring the rules on a different bucket on FlashBlade as shown above. The ruler provides a global set of rules for different Prometheus servers. This global set is stored in a shared object store location on FlashBlade for high resiliency and availability.
Query or Querier: The query pulls data from different Prometheus servers, merges it, and deduplicates based on the promql queries. The query becomes the data source to Grafana instead of each individual Prometheus server. It also understands the Prometheus storage format. The query reduces the overall per-request cost to read the historical data from the back-end object storage on FlashBlade by merging or concatenating the data in smaller chunks. As a result, it avoids large read overheads.
The historical data in the store bucket is different from the ruler bucket. The historical data bucket store can be replicated independently from FlashBlade to Amazon S3 if there’s a requirement to archive the historical data. In most cases, the ruler bucket may not need to be archived.
Settings for Implementation
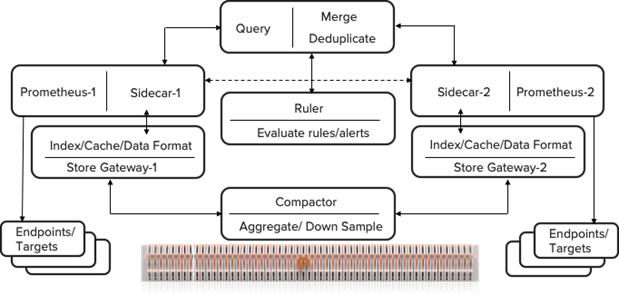
Figure 3: Prometheus Thanos on FlashBlade functional layout
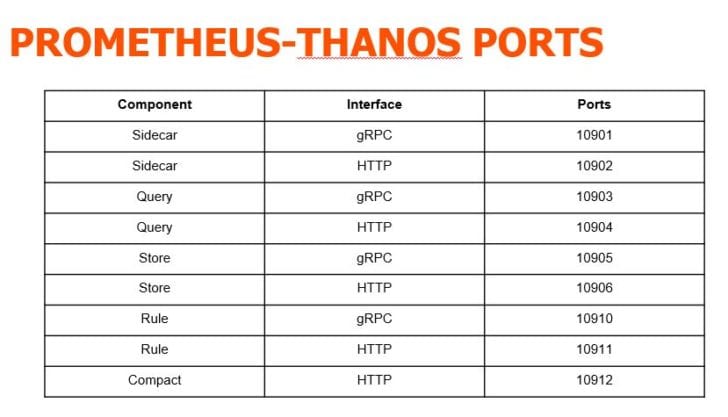
In the functional diagram above, there are two forms of communication. Thanos uses HTTP to communicate with Prometheus queries and gRPC internally across all the components using StoreAPI.
The following table highlights the different port numbers that are used for HTTP and gRPC for various Thanos components. More detailed information is available in the Prometheus Thanos implementation guide.
In a Thanos implementation, there will be many single instances of Prometheus servers glued together in high-availability format with shared storage on FlashBlade over NFS and S3 respectively. The sidecar component of Thanos uses an “external label” in the Prometheus configuration to identify the promql queries for endpoints and targets that are scraped by various Prometheus servers.
|
|
Every Prometheus instance in the environment will be identified by an external label that includes a cluster location name and a replica name in that location.
The scrape_timeout and scrape_interval settings for scraping Pure FlashArray™ and FlashBlade endpoints in a Thanos environment are other important settings to be aware of. Werecommend configuring the scrape_timeout value to 1m under “global” as shown above.
The suggested scrape interval values for various Pure jobs are listed below. We recommend adjusting the scrape_interval time for various Pure job settings depending on the number of endpoints scraped by a single Prometheus server to avoid any race condition.
|
1 2 3 4 5 6 7 8 9 10 11 12 13 14 |
- job_name: 'pure_flashblade' scrape_interval: 15s - job_name: 'pure_flashblade clients' scrape_interval: 1m - job_name: 'pure_flashblade quotas' scrape_interval: 90s - job_name: 'pure_flasharray' scrape_interval: 15s |
Sometimes a race condition may result in the following error in the Prometheus server. Adjusting the scrape_interval values clears it.
|
1 |
Get "https://pure-exporter-1:9491/metrics/flashblade/quotas?apitoken=T-a908495c-16d2-46a5-90c1-b16abd5a4b6a&endpoint=10.21.241.151": EOF |
FlashBlade is a unified fast file and object platform that allows you to scale the bucket capacities for storing long-term historical data with data reduction up to 4:1. The Prometheus time series database (TSDB) and the data directory for various Thanos components like store and compact are configured over NFS over FlashBlade for resiliency and scale. With FlashBlade object replication, the historical data in the store bucket can be archived in AWS S3 for long-term retention.
![]()