This article originally appeared on Medium.com and has been republished with permission from the author.
To aggregate logs directly to an object store like FlashBlade, you can use the Logstash S3 output plugin. Logstash aggregates and periodically writes objects on S3, which are then available for later analysis. This plugin is simple to deploy and does not require additional infrastructure and complexity, such as a Kafka message queue.
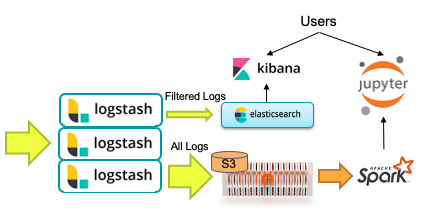
A common use-case is to leverage an existing Logstash system filtering out a small percentage of log lines that are sent to an Elasticsearch cluster. A second output filter to S3 would keep all log lines in raw (un-indexed) form for ad-hoc analysis and machine learning. The diagram below illustrates this architecture, which balances expensive indexing and raw data storage.
Logstash Configuration
An example Logstash config highlights the parts necessary to connect to FlashBlade S3 and send logs to the bucket “logstash,” which should already exist. The input section is a trivial example and should be replaced by your specific input sources (e.g., filebeats).
input {
file {
path => [“/home/logstash/testdata.log”]
sincedb_path => “/dev/null”
start_position => “beginning”
}
}
filter {
<code”>}
output {
stdout {
codec => rubydebug
}
s3{
access_key_id => “XXXXXXXX”
secret_access_key => “YYYYYYYYYYYYYY”
endpoint => “https://10.62.64.200"
bucket => “logstash”
additional_settings => {
“force_path_style” => true
}
time_file => 5
codec => “plain”
}
}
Note that the force_path_style setting is required; configuring a FlashBlade endpoint needs path style addressing instead of virtual host addressing. Path-style addressing does not require co-configuration with DNS servers and therefore is simpler in on-premises environments.
For a more secure option, instead of specifying the access/secret key in the pipeline configuration file, they should also be specified as environment variables AWS_ACCESS_KEY and AWS_SECRET_ACCESS_KEY.
Logstash can trade off efficiency of writing to S3 with the possibility of data loss through the two configuration options “time_file” and “size_file,” which control the frequency of flushing lines to an object. Larger flushes result in more efficient writes and object sizes, but result in a larger window of possible data loss if a node fails. The maximum amount of data loss is the smaller of “size_file” and “time_file” worth of data.
Validation Test
To test the flow of data through Logstash to FlashBlade S3, I use the public docker image for Logstash.
Starting with the configuration file shown above, customize the fields for your specific FlashBlade environment and place them in ${PWD}/pipeline/ directory. We then volume-mount the configuration into the Logstash container at runtime.
Start a Logstash server as a Docker container as follows:
> docker run --rm -it -v ${PWD}/pipeline/:/usr/share/logstash/pipeline/ -v ${PWD}/logs/:/home/logstash/ docker.elastic.co/logstash/logstash:7.6.0
Note that I also volume-mounted the ${PWD}/logs/ directory, which is where Logstash will look for incoming data.
In a second terminal, I generate synthetic data with the flog tool, writing into the shared “logs/” directory:
> docker run -it --rm mingrammer/flog > logs/testdata.log
Logstash will automatically pick up this new log data and start writing to S3.
Then look at the output on S3 with s5cmd; in my example the result is three objects written (5MB, 5MB, and 17KB in size).
> s5cmd ls s3://logstash/
+ 2020/02/28 04:09:42 17740 ls.s3.03210fdc-c108–4e7d-8e49–72b614366eab.2020–02–28T04.04.part28.txt
+ 2020/02/28 04:10:21 5248159 ls.s3.5fe6d31b-8f61–428d-b822–43254d0baf57.2020–02–28T04.10.part30.txt
+ 2020/02/28 04:10:21 5256712 ls.s3.9a7f33e2-fba5–464f-8373–29e9823f5b3a.2020–02–28T04.09.part29.txt
Making Use of Logs Data with Spark
In Pyspark, the log lines can be loaded for a specific date as follows:
logs = sc.textFile(“s3a://logstash/ls.s3.*.2020–02–29*.txt”)
Because the ordering of the key places the uid before the date, each time a new Spark dataset is created it will require enumerating all objects. This is an unfortunate consequence of not having the key prefixes in the right order for sorting by date.
Once loaded, you can perform custom parsing and analysis, use the Spark-Elasticsearch plugin to index the full set of data, or start machine learning experiments with SparkML.
![]()