The performance and health of databases, commercial and custom software, and underlying infrastructure is critical to modern workflow pipelines. Prometheus, Alert Manager, and Grafana are some of the most commonly used tools for monitoring, alerts, and visualizing metrics for applications and infrastructure endpoints in a production environment.
Prometheus is a popular choice because it:
- Is open source and doesn’t require buying a license
- Offers flexible retention time for historical data
- Eliminates the need for custom monitoring and visualizing tools from specific vendors
- Provides single-pane management for various software and hardware in the environment
- Enables role-based access to metrics for personas like administrators, data engineers and scientists, developers, and others
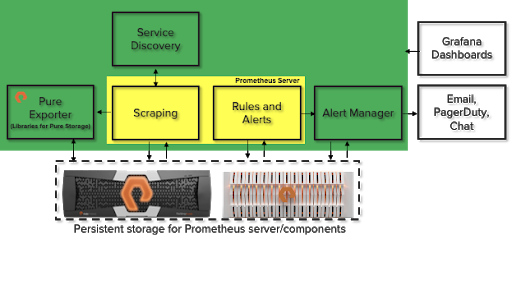
Pure Storage® FlashArray™ and FlashBlade® are key infrastructure components in many data centers. Prometheus scrapes metrics from FlashArray and FlashBlade using Pure Exporter along with other software and hardware infrastructure components in the environment. You can use FlashArray over ext3 or ext4 file systems as an external storage device to set up and configure Prometheus, Alert Manager, and Grafana.
Another storage option is FlashBlade over NFS, which provides capacity scaling, data reduction, and the stability required for Prometheus. For more information, refer to the white paper on Prometheus and Grafana with Pure Storage.
A Closer Look at Prometheus with FlashArray and FlashBlade
Prometheus needs endpoints or targets to scrape. Each individual target is an instance that provides metric data in a format Prometheus understands. All the targets dump their respective data in the format Prometheus can read from the /metrics location based on the scrape interval setting. A collection of instances that serve the same purpose is called a job.
|
1
2
3
4
5
6
7
8
9
10
11
12
13
14
15
16
17
18
|
– <span style=”color: #00ff00;”>job</span>_name: ‘<span style=”color: #ff0000;”>pure_flashblade</span>’
scrape_interval: 5s
metrics_path: /metrics/flashblade
static_configs:
– <span style=”color: #00ff00;”>targets</span>: [ 10.21.241.151 ]
<span style=”color: #00ff00;”>labels</span>:
__pure_apitoken: T-0b8ad89c-b28a-4289-85ed-286607dc2cd2
– <span style=”color: #00ff00;”>targets</span>: [ 10.21.241.11 ]
<span style=”color: #00ff00;”>labels</span>:
__pure_apitoken: T-6773eccd-2a17-4f09-bc1c-8db062fb8b6a
– <span style=”color: #00ff00;”>job</span>_name: ‘<span style=”color: #ff0000;”>pure_flasharray</span>’
scrape_interval: 10s
metrics_path: /metrics/flasharray
static_configs:
– <span style=”color: #00ff00;”>targets</span>: [ 10.21.126.18 ]
<span style=”color: #00ff00;”>labels</span>:
__pure_apitoken: 2206c74b-fe59-a04f-b47c-af23fe611528
|
As shown in the above example, FlashArray and FlashBlade targets can run as separate jobs in Prometheus. Each job will have a set of common counters that will be scraped for multiple FlashArray and FlashBlade targets. In the example, there are two FlashBlade targets listed under a single job. The metrics_path is set to /metrics/flashblade and /metrics/flasharray respectively to dump all of the array-level data.
Prometheus follows a multidimensional data model that uses metrics and key-value pairs and stores them in a time-series format. Metrics are a data structure that link data samples over time. A metric consists of a metric name and its dimension. The dimension is differentiated by a label and its corresponding value. In the following data format example, Prometheus is gathering metrics from FlashBlade using Pure Exporter.
|
1
2
3
4
|
purefb_array_specific_performance_latency_usec{dimension=”file_metadata_create”,instance=”10.21.241.151″,
job=”pure_flashblade”,protocol=”nfs”}
purefb_array_specific_performance_latency_usec{dimension=”file_metadata_modify”,instance=”10.21.241.11″,
job=”pure_flashblade”,protocol=”nfs”}
|
"purefb_array_specific_performance_latency_usec” is the metric is this example. “dimension="file_ metadata_ create,instance="10.21.241.151",job="pure_flashblade", protocol="nfs" " represent the different labels with its corresponding values. These labels can be filtered and aggregated based on the monitoring requirements. The whole “purefb_array_specific_performance_latency_usec {dimension="file_metadata_modify",instance="10.21.241.11",job="pure_flashblade",protocol="nfs"}” represents a time series. Prometheus supports four different types of metrics: counter, gauge, histogram, and summary.
You can configure Prometheus to scrape multiple FlashArray and FlashBlade targets as well as thousands of other endpoints and targets in the environment. Prometheus has native timestamp and numeric value compression while storing the time-series data on external storage using delta-to-delta encoding. That means Prometheus stores incremental delta changes between the current and new time-series data samples.
FlashArray and FlashBlade provide data reduction on the external storage. FlashBlade for Prometheus time-series data test results showed a consistent data reduction of 2:1 while scraping multiple FlashBlade and FlashArray targets and nodes. Data compression by Prometheus and FlashBlade complements each other to reduce the overall monitoring data footprint while scraping thousands of endpoints and targets with high retention time.
The Prometheus server is connected to a time-series database. Scaling a high number of promSQL queries will be challenging with a single Prometheus server. We recommend using several Prometheus servers depending on the number of targets and metrics being scraped. However, the real challenge is to merge and compact time-series data samples under one global view. We’ll explore ways to solve this challenge in a future blog post.
Generating Alerts
Prometheus can generate alerts based on the rules you specify. The rules are mostly defined as a threshold for various active endpoints and targets. You might specify a rule to generate an alert for Pure Storage if capacity utilization for mounted file-systems is over 75%, network utilization is over 80%, or Linux host-free memory drops below 10%. Once the condition for any of the rules is met, Prometheus enters into a firing state and sends hundreds to thousands of alerts to the Alert Manager (Figure 2).

Alert Manager receives the alerts from the Prometheus server and performs different actions on the alerts. It groups and deduplicates the alerts from different targets. It also suppresses and silences (like the snooze button on an alarm clock) notifications from certain alerts using the process of Inhibitions and Silences. Once the alerts are formatted according to the configuration in the Alert Manager, they’re routed to notification channels like Slack, email, and PagerDuty.
An NFS share on FlashBlade allows the Alert Manager to store the notification states, Inhibitions, and Silences. Data reduction on the FlashBlade also helps to reduce the overall Alert Manager data footprint during the alerting and notification process.
Visualizing Data
Prometheus can graph metrics gathered from various targets. However, visualization is limited and it’s not possible to customize dashboards. Grafana is one of the most popular visualization tools and supports many data sources. However, for the purpose of this post, we’re using Prometheus as the data source.
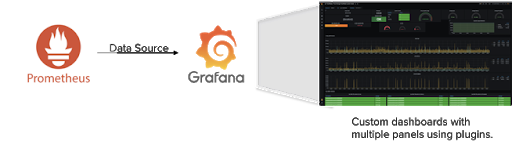
Grafana can filter and aggregate metrics from FlashArray and FlashBlade along with other targets. It can visualize the data in custom dashboards using various plug-ins, such as gauges, bar gauges, tables, or heat maps. The panels in the dashboards can represent different time-series data samples from Prometheus.
The grafana.db is configured on an NFS share on FlashBlade and stores dashboards, user permissions, alerts, and more. Ideally, the FlashBlade device provides a data reduction of 6:1 for the Grafana database and plug-ins.
Like Alert Manager and Prometheus, Grafana has alerts. But, Grafana alerts aren’t scalable. They’re tied to a specific dashboard and can’t be shared in templates. For large enterprises, we always recommend using Alert Manager for alerts.
To summarize, Prometheus, Alert Manager, and Grafana are a popular trio of solutions for monitoring, alerting, and reporting on the many targets in a production environment. Configuring these tools on Pure Storage provides the stability and capacity scaling you need for retention and data efficiency by reducing the overall data footprint. In a future blog post, we’ll look at scaling Prometheus with a global view and using object storage for data retention.