Prometheus is an open-source time-series database used for monitoring and alerting. The data is scraped in regular intervals from endpoints using client libraries called exporters that expose the metrics in a Prometheus format. A Prometheus server then collects those metrics via HTTP requests and saves them with timestamps in a database.
Prometheus can be used to collect metrics about the CPU, memory, and network utilization of an AI cluster. The short instructions for adding Prometheus to a Rancher-based Kubernetes cluster can be found here. By default, that Prometheus application will collect metrics from the exporters native to the cluster – such as usage stats for all the Kubernetes pods.
However, you might have additional infrastructure in your AI cluster beyond the compute servers that the Kubernetes pods are running on. For example, you might have shared storage that needs to be monitored as well.
Training and inference pipelines often include a variety of applications like Kafka for message queuing and JupyterHub for exploring models. Having a shared data platform like Pure Storage FlashBlade™ is beneficial for these pipelines because it enables:
- easy access to shared datasets
- seamless collaboration among data scientists
- a cost-effective way to scale capacity and performance as needed
In this blog post, we’ll cover the steps to use our Pure Exporter for FlashBlade so you can have a single pane of glass for monitoring your entire AI cluster.

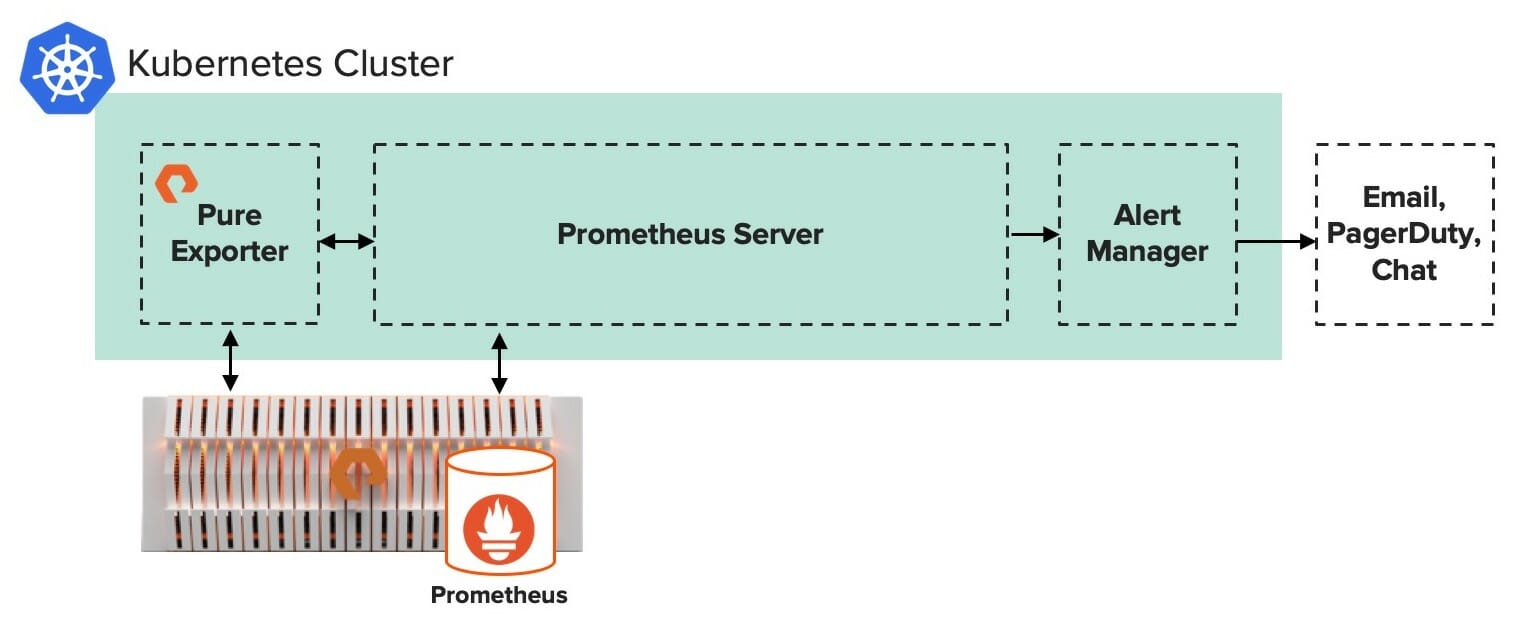
As shown in the diagram above, the Pure Exporter runs in a Kubernetes pod. Kick off a workload with the Pure Exporter docker image, which can be downloaded here.

Once the Pure Exporter is running as a pod, note the cluster-IP and port values for the pure-exporter. You can find them by running “kubectl get svc”:
|
1 2 3 4 5 |
$ kubectl get svc NAME TYPE CLUSTER-IP EXTERNAL-IP PORT(S) AGE kubernetes ClusterIP 10.43.0.1 <none> 443/TCP 113d pure-exporter ClusterIP 10.43.255.64 <none> 9491/TCP 98d pure-exporter-nodeport NodePort 10.43.95.229 <none> 9491:31252/TCP 98d |
Next, edit the Prometheus server configmap to include a new job to scrape the FlashBlade metrics.
|
1 2 3 4 5 6 7 8 9 10 11 12 13 14 15 16 |
- job_name: 'pure_flashblade' scrape_timeout: 30s metrics_path: /metrics/flashblade relabel_configs: - source_labels: [__address__] target_label: __param_endpoint - source_labels: [__pure_apitoken] target_label: __param_apitoken - source_labels: [__address__] target_label: instance - target_label: __address__ replacement: 10.43.255.64:9491 # cluster-IP:port static_configs: - targets: [ 10.61.169.20 ] # eternally addressable FlashBlade IP address labels: __pure_apitoken: <<your_API_token>> |
FlashBlade will be now listed as a target in the Prometheus server and ready to scrape. Prometheus now knows where to find the “/metrics/flashblade” endpoint on the Pure Exporter pod.
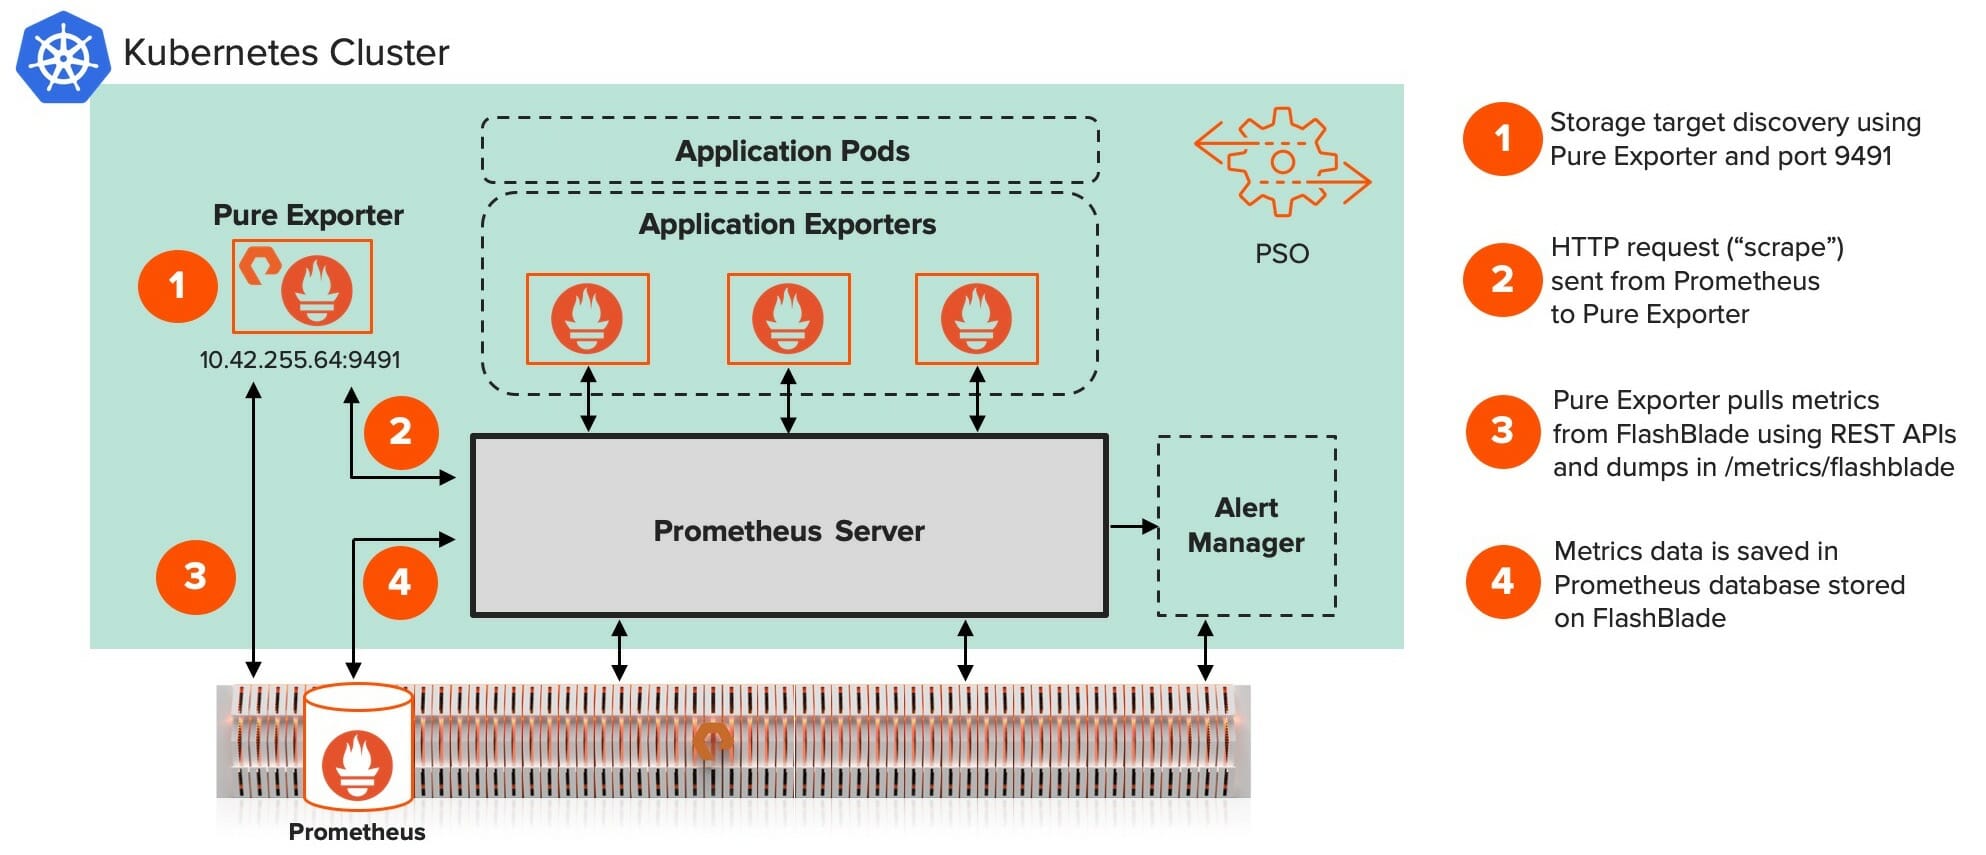
So, now the overall flow looks like this:

The Prometheus server discovers the FlashBlade through the Pure Exporter and port 9491 in the Kubernetes cluster. The Pure Exporter gathers the FlashBlade metrics data using RESTful APIs . The collected data is then stored in the Prometheus database.
(In fact, that database is stored in the FlashBlade itself. Storing the monitoring data on FlashBlade provides the ability to scale as AI workloads increase. FlashBlade also provides data reduction of ~2:1 for Prometheus database!)
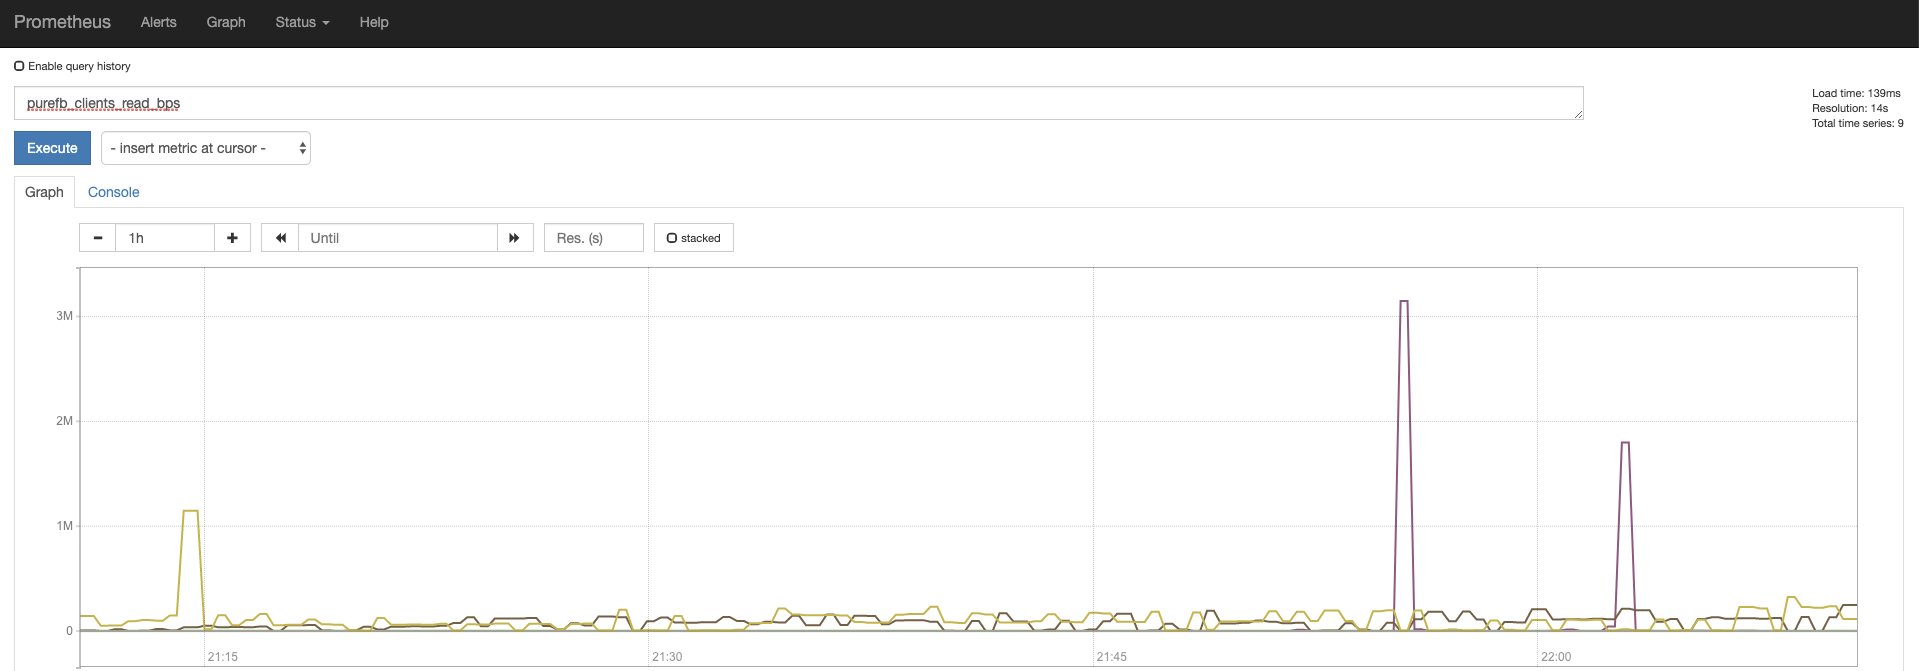
Once the metrics are stored in the Prometheus database, it is easy to query.

Here, we’re visualizing a metric directly from Prometheus, but it’s easy to pull the data forward into Grafana for beautiful, easy-to-create dashboards. We’ll review Grafana integration into the AI Data Hub in our next post in this series.
To summarize, Pure Exporter allows Prometheus to scrape metrics from Pure Storage data platforms using RESTful APIs.
- No additional scripting needed to monitor storage along with the rest of the cluster.
- FlashBlade is a great place to save a cluster’s Prometheus database since it provides the simplicity of centralized logs and performant scalability.
The next post will demonstrate how to configure and integrate a FlashBlade metrics dashboard into Grafana for the AI cluster. Visit the blog for our next posts in the series over the coming weeks:
- Automating an inference pipeline in a Kubernetes Cluster
- Tuning networking configuration of a Kubernetes-based AI Data Hub
- Integrating Pure RapidFile Toolkit into Jupyter notebooks
See the previous posts in the series, Providing Data Science Environments with Kubernetes and FlashBlade and Storing a Private Docker Registry on FlashBlade S3.


