I wrote a blog post a year or so ago about ESXi and storage queues which has received a lot of wonderful feedback (thank you!!) and I eventually turned it into a VMworld session and other engagements:
So in the past year I have had quite a few discussions around this. And one part has always bothered me a bit.
In ESXI, there are a variety of latency metrics:
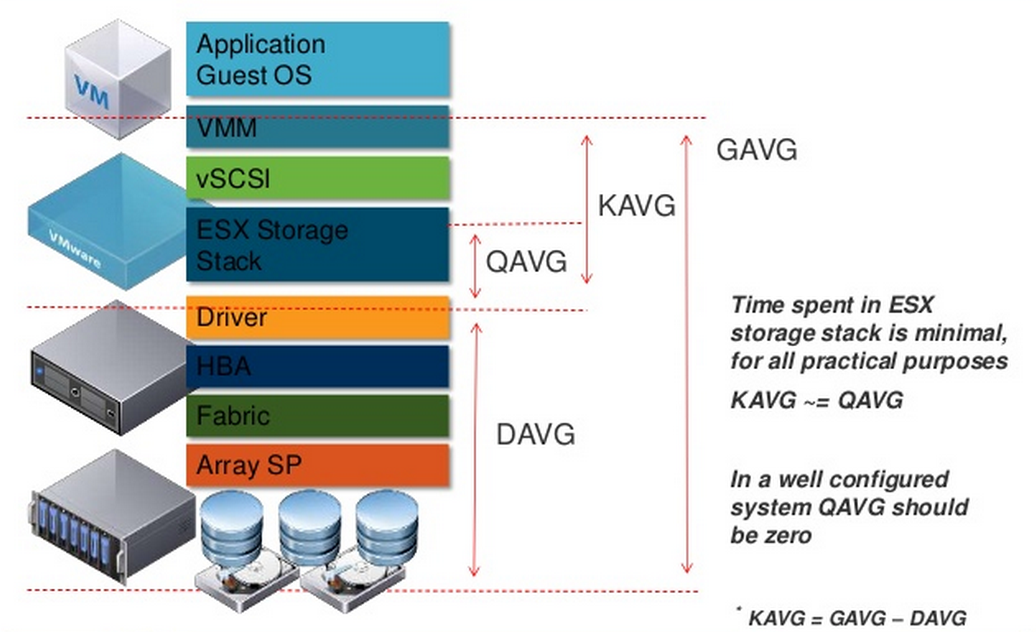
- GAVG. Guest average. Sometimes called “VM observed latency”. This is the amount of time it takes for an I/O to be completed, after it leaves the VM. So through ESXi, through the SAN (or iSCSI network) and committed to the array and acknowledged back.
- KAVG. Kernel average. This is how long an I/O is spending in the ESXi kernel. If this is anything but zero, there is some kind of bottleneck (often a maxed out queue)
- DAVG. This is how long it takes for the I/O to be sent from host, through the SAN and to the array and acknowledged back.
But you might note that there is a QAVG too. Queue Average. VMware defines it as:
“QAVG: The average queue latency. QAVG is part of KAVG. Response time is the sum of the time spent in queues in the storage stack and the service time spent by each resource in servicing the request. The largest component of the service time is the time spent in retrieving data from physical storage. If QAVG is high, another line of investigation is to examine the queue depths at each level in the storage stack.”
So it is a part of KAVG. It is the amount of time an I/O spends waiting in the queue (if there is queuing) and KAVG adds any additional latency in the case of CPU contention, or if something is causing ESXi to hold the I/O in the kernel. This is why KAVG and QAVG is essentially always equal. If you hit the queue depth limit and latency is induced due to that, the latency is recorded in QAVG and also in KAVG.
Okay cool. Great.
But KAVG and QAVG always seem to be the same number. So what was the value in one or the other?
QAVG is a subset of KAVG. Like shown in this image that is plastered all over the internet.
I ran into two situations where I questioned this:
- First a customer had really slow Storage vMotions from an old array to their FlashArray. Looking at esxtop, KAVG and QAVG were crazy high. Turned out to be a bad cable which was causing all kinds of aborts.
- I was testing array-based throughput limits on a volume. This also caused crazy high KAVG and QAVG (which is of course would be expected).
But the weird thing, was that QAVG was HIGHER than KAVG.
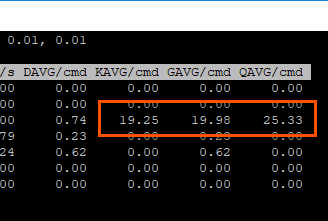
How is that possible? As you can see in the below screenshot, QAVG is 25 ms while KAVG is 18 ms.

So how could something that is a subset of something else be larger than the parent? That’s some bad math.
So I had three guesses:
- Some crazy sampling error.
- The documentation everywhere was wrong.
- I’m completely missing something.
Maybe a mix of the three?
I really didn’t think it was the first option. Too consistent and too different. The second option also seemed unlikely, but maybe the current documentation wasn’t really wrong, but more of an oversimplification? Number 3 seemed the most likely.
So I reached out to VMware on this one. Thanks to Mark and Jason, for setting up this call. I explained my situation and they agreed I was not crazy (well concerning this) and something indeed seemed wrong.
Enter VMware engineering.
After some more discussion, this was the scoop. The answer is a bit of all three of the above options.
The first thing to understand is that GAVG is measured. DAVG is measured. QAVG and KAVG are actually calculated. (KAVG = GAVG – DAVG for instance). But that is not the cause of the issue really. The thing to understand about KAVG, DAVG, and GAVG is that they only measure VM I/O activity. They do not measure all I/O. There is a variety of hypervisor I/O that occurs as well.
Hypervisor I/O is low priority. Guest (VM) I/O is high priority.
Therefore in times of contention, hypervisor I/O gets pushed out of the way. Big time. So if there is a bad cable, causing aborts and I/Os to be stuck in the queue to retry, etc. Or if the array is throttling. This non-VM I/O will be punished in favor of serving your VMs.
So back to QAVG. Why is it higher if it is indeed a subset of KAVG? Well it is because what esxtop reports under those metrics are not calculated from the same set of data. KAVG is calculated from VM I/O only. QAVG is actually all I/O in the queue–including hypervisor metadata changes and other operations.
So the average for KAVG is lower. Since the hypervisor I/O is throttled so much more, its average latency is much higher. So this throws off the average and makes QAVG much higher than KAVG. So it is not wrong, QAVG is a subset of KAVG. But since these are calculated values, not measured ones, and use different data sets to calculate themselves, they do not appear to line up with this logic.
We can prove this out. In esxtop, the reported average latency is 19 ms. The QAVG is 25 ms.
In my VM, the average latency is 19 ms.
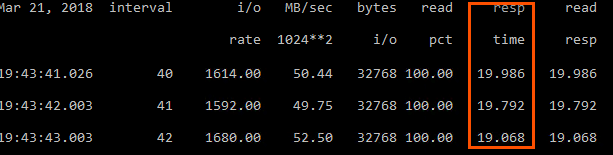
Not 25 ms as reported in QAVG. So the guest is not experiencing the higher latency.
So what does this mean?
Well, a few things. It is actually fairly helpful.
- If you see QAVG and KAVG are non-zero and equal. You likely have hit your queue depth limit, or for some reason ESXi itself is throttling the queue. Look at my video above or the earlier blog post.
- If you see QAVG and KAVG are non-zero but unequal (QAVG is higher) you either have a SAN issue, or the array is overwhelmed or QoS throttling.
I will be digging a bit deeper into this, I will be sure to report more if I found out more.