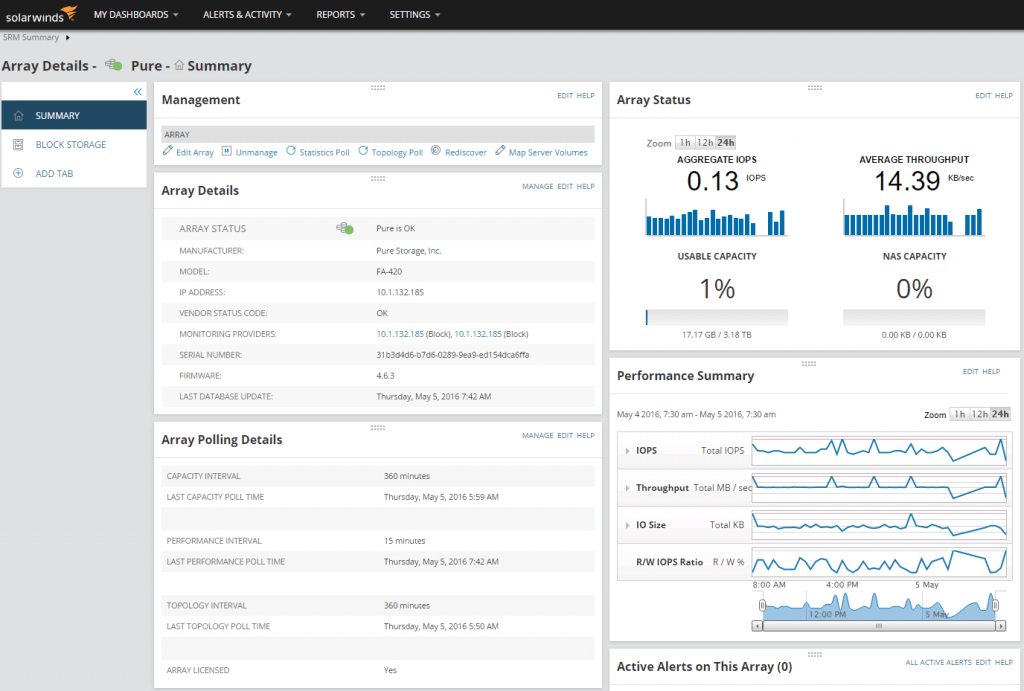
After several months of work by SolarWinds engineering in conjunction with a Pure Storage® integration team, the latest SolarWinds Storage Resource Monitor (SRM) was launched on June 7th with full support for the Pure Storage FlashArray. The integration leveraged a combination of REST API (v1.4) and embedded SMI-S provider (CTP 1.6.1) on the FlashArray (Purity 4.7) to monitor for configuration, capacity and performance.
What’s behind the SolarWinds and Pure Storage Partnership?
What initially brought SolarWinds and Pure Storage product teams together was a shared customer posting a request for FlashArray support to the SolarWinds THWACK® community. For those who don’t know, THWACK is a great, collaborative space where customers can post their ideas and vote to get them on the roadmap along with other great resources and media content. After multiple votes were cast for integration along with some amazing customer comments, SolarWinds product team made the decision to support FlashArray integration in the following release of Storage Resource Monitor.
What is the SolarWinds SRM?
SolarWinds SRM is part of a SolarWinds IT management suite of tools that brings contextual monitoring of compute, network and storage across virtualization and application layers. The analytics built into SRM help answer several fundamental questions for the users:
- Where do I place new application workloads? Dashboards provide at a glance view of all of the systems under management and their capacity and performance.
- Where are the resource bottlenecks? Allows users to trend performance across compute, network and storage to help rebalance workloads.
- What resources are underutilized or no longer in use? Allows users to reclaim orphaned capacity or decommission resources.
- How do I drive actionable alerting? Intelligent alerting helps users create trigger conditions that correlate multiple values allowing users to establish what is normal versus abnormal behavior of the system and notify appropriate teams to drive remediation.
- When do I order more storage? This is based on capacity trending and forecasting capabilities.
Engineering SolarWinds for FlashArray
In the case of Pure Storage FlashArray, the SolarWinds engineering team had to rethink how they approach capacity and performance monitoring on all flash. The array wide data reduction often impacts predictive algorithms found in storage resource management products as users consolidate more workloads. Add services such as thin provisioning, LUN copy and snapshots and now capacity trending becomes even more interesting. As an example, a copy of the volume is no longer exercise in re-creating LUN capacity somewhere else on the array but simply having FlashArray meta engine point to existing capacity and only persisting unique changes to both volumes. Per volume reporting becomes challenging as LUNs are virtualized on the meta level where shared LUN space is the norm plus these LUNs are thin provisioned.
The benefits of using data reducible arrays are significant, allowing users to squeeze more data in the same rack space at the fraction of cabling and power costs and most importantly driving cost of flash down to be on par or even better than disk. For example, Pure Storage FlashArray does dedupe at a variable block size starting at 4k block and looking at incremental 512 bytes of data resulting in granular data reduction often twice as good as leading competitive products.

Because of this new reality of flash-based data-reducible storage arrays, resource management tools must rethink how array wide reduction impacts accuracy of the reporting. SolarWinds SRM takes the reduction seen on the array into the account however not all storage vendors implement data reduction the same way thus creating reporting inconsistencies between vendors. Users must keep that in mind when they are trying to do apples to apples comparisons between vendors and report up to their management aggregated storage utilization.
While it is almost impossible to account for the data deduplication, compression and zero pattern removal, time becomes your friend because the longer data sits on the array the better the capacity and performance forecasting. That is why SRM maintains capacity and performance data for several months so you can leverage past trending data to look into the future with some level of certainty. This helps with capacity planning by providing time to pre-order capacity for existing growth and maintain buffer for new workloads.
Performance Monitoring
Another great topic is performance monitoring on all-flash array. For instance, it is important to understand the impact of IOPS, IO size, concurrency, internal/external latency, and data throughput on the behavior of an application workloads. Monitoring these metrics becomes essential to help identify bottlenecks while also working closely with application owners to understand what is normal versus abnormal behavior of the application. Focusing on an individual metric is a fool’s errand.
Instead, it is much better to correlate multiple metrics and match that to the expected behavior of an application workload. In addition, the sense of normal and abnormal changes with the application as it evolves over time to have more users, features and supported infrastructure (more powerful switches, servers and storage arrays).
How does SolarWinds SRM help with monitoring performance on all-flash array?
SRM has sophisticated alerting engine that allow users to create trigger conditions to correlate multiple metrics. For example, users can look at fluctuations in average latency as it compares to the average size of reads or writes, and trigger when the average latency exceeds a specific threshold for a certain period of time. Users can then describe how they want to be notified. These triggers help users to define what is normal versus abnormal based on application grouping.
For example, if we have exchange environment with 1,000 mailboxes sitting on this set of volumes. You can simply create a group of LUNs along with other resources to define threshold alerting. But before even playing around with these alerts, don’t forget to talk to your application owners about their expectations of normal/abnormal and allow SRM to create enough performance trending data to see behavior over time and then select thresholds conditions that match to expectations and stay within certain percentage standard deviation of the baseline.
Bottom line, we are seeing how all-flash arrays change the landscape of storage monitoring and economics of the data center and it is wonderful to see SolarWinds keeping up with this change.
Conclusion
The integration of SolarWinds Storage Resource Monitor (SRM) with Pure Storage FlashArray marks a significant advancement in storage monitoring and resource management. This collaboration addresses the complexities of monitoring all-flash storage systems, enabling users to effectively track performance, capacity, and utilization while leveraging the efficiency of data-reducible arrays.
By accommodating the unique characteristics of FlashArray—such as advanced data reduction, thin provisioning, and granular reporting—SRM ensures accurate forecasting and intelligent alerting. These capabilities empower IT teams to optimize resource allocation, reduce costs, and maintain seamless operations across compute, network, and storage layers. Furthermore, the advanced alerting engine helps define thresholds and identify bottlenecks, ensuring applications perform optimally over time.
This partnership demonstrates the evolving synergy between innovative storage technologies and resource management tools, redefining the economics and efficiency of modern data centers. Explore the capabilities of SolarWinds SRM with Pure Storage FlashArray to unlock the full potential of your storage infrastructure.
Download a free trial version and try it out with your Pure Storage FlashArray today!

Free Test Drive
Try FlashArray
Explore our unified block and file storage platform.


