Summary
Embodied carbon dioxide equivalent (CO2e) is a sustainability metric that can be used when evaluating enterprise storage systems’ impact on the environment. When you conduct a system-level comparison, flash-based systems can have a notably lower CO2e than HDD-based systems.
Recently there have been a number of web articles and blog posts comparing the embodied carbon dioxide equivalent (CO2e) of commodity off-the-shelf (COTS) hard disk drives (HDDs) vs. solid-state disks (SSDs). If you take those comparisons at face value, chances are you’d walk away believing that on this sustainability metric, SSDs are up to 8x worse than HDDs with the implicit suggestion that building storage systems from flash is much worse for the environment than building them with spinning disk. If you look at more recent CO2e data on HDDs and SSDs though, that number is far closer, and depending on which flash devices you compare, it can be less than 2x on a per terabyte (TB) basis.
After updating device-level comparisons to current figures, we ran a system-level comparison that clearly shows that flash-based systems can have a notably lower CO2e than HDD-based systems, depending on which vendors are used for comparison. I also validated why using device-level instead of system-level comparisons to make sustainability arguments about enterprise storage systems is extremely misleading.
Getting to an Updated Embodied Carbon Dioxide Equivalent Baseline
One University of Wisconsin study compared COTS HDDs and SSDs manufactured in 2017, comparing the embodied carbon dioxide per terabyte (CO2e/TB) during manufacturing of a 1TB consumer-grade HDD and a 1TB consumer-grade SSD. The study showed embodied emissions of 20 kg CO2e/TB for the HDD and 160 kg CO2e/TB for the SSD, an 8x difference! Using publicly released data from SSD drive vendors for enterprise drives manufactured in 2021, I compared an 18TB Seagate Exos X20 HDD with a CO2e/TB of 1.2kg with a 15TB Seagate Nytro 3332 SSD with a CO2e/TB of 2.91 kg. Instead of an 8x difference, the SSD had an embodied carbon content of only 2.4x that of the comparable HDD.
If we look at industry trends since 2017, there’s no doubt that SSD manufacturing emissions per TB have been rapidly decreasing (by almost 10x since 2017), while at the same time, SSD density is increasing faster than HDD density. The table in Figure 1 below was taken from the Western Digital Fiscal Year 2022 Sustainability Report, page 43, and shows the average greenhouse gas (GHG) emissions intensity ratio across all the vendor’s manufactured HDDs and SSDs for successive years. The GHG emissions intensity ratios for HDDs and SSDs per TB sold in 2020 showed SSDs at 2.5x higher (4.3/1.7), but it’s clear to see that each subsequent year SSDs were improving by much more than HDDs. By 2022, the data showed that the SSD GHG emissions intensity ratio for SSDs per TB had dropped by 49% to 2.2, whereas the HDD GHG emissions intensity ratio had dropped by only 29% to 1.2, showing that SSDs were only 1.83x higher (2.2/1.2) in GHG emissions intensity in that year.

Figure 1. A GHG emissions intensity ratio comparison of HDDs and SSDs in FY22 published by Western Digital.
But we shouldn’t stop there. What about the impact of device lifecycles on CO2e? Most HDD vendors provide a warranty in the range of two to five years, while SSD vendors uniformly quote five years. Backblaze, an independent cloud storage and data backup company that publishes storage device reliability numbers based on a study of hundreds of thousands of devices running in their own labs that was started in 2013, tracks HDD and SSD failures in continuously running tests. Backblaze’s most recent data shows that HDDs fail roughly 50% more often than SSDs and of those tracked HDD failures, the average age at failure is 2 years 10 months. Note that if an SSD lasts 1.83 times as long as an HDD, then it has achieved equivalent CO2e, and the chance of that happening is pretty good in enterprise environments.
Based on this, it’s clear that SSDs are much closer to HDDs in terms of GHG emissions intensity per TB and the disparity that still exists can be offset by the longer life cycle of SSDs. And the embodied carbon per TB gap between HDDs compared to SSDs will continue to narrow going forward as flash manufacturing efficiencies improve and fabrication facilities leverage greener power generation sources.
Are Device-level Comparisons Even Relevant for Enterprise Storage?
I’ve commented on other HDD vs. SSD comparisons that used device-level comparisons in the past—in particular, those that showed that HDDs have a much lower $/GB cost for raw capacity. If you’re trying to make comparisons between computers like laptops that are likely to only have one on-board storage device, maybe a device-level comparison works. But enterprise storage systems often have hundreds or thousands of storage devices, and the comparison dynamics are very different in those types of environments. I would go so far as to say that using device-level comparisons to make sustainability arguments about enterprise storage systems is extremely misleading.
I’ve covered these arguments at length in other publications, but I’ll summarize here why device-level comparisons are so misleading for enterprise storage. To do a relevant comparison for enterprise storage systems, you need to set a target performance and capacity requirement for the system, then build up the system that can meet that requirement using HDDs or SSDs. Then you need to take into account the capacity savings with flash that accrue from a higher raw to usable capacity conversion (higher capacity utilization, more efficient erasure coding). Due to the significantly higher performance and densities and higher raw to usable capacity conversion ratios of SSDs, you end up needing far fewer SSDs than you do HDDs, which also means you need far less supporting infrastructure (controllers, enclosures, fans, power supplies, switching infrastructure)—all of which drives higher cost, energy consumption, carbon emissions, and e-waste at the end of a product’s life.
Keep in mind that the much better performance of SSDs means you can use much larger devices while still meeting performance and disk rebuild time goals, and you can use storage reduction technologies like deduplication that work in real time to further increase the effective capacity of SSDs.
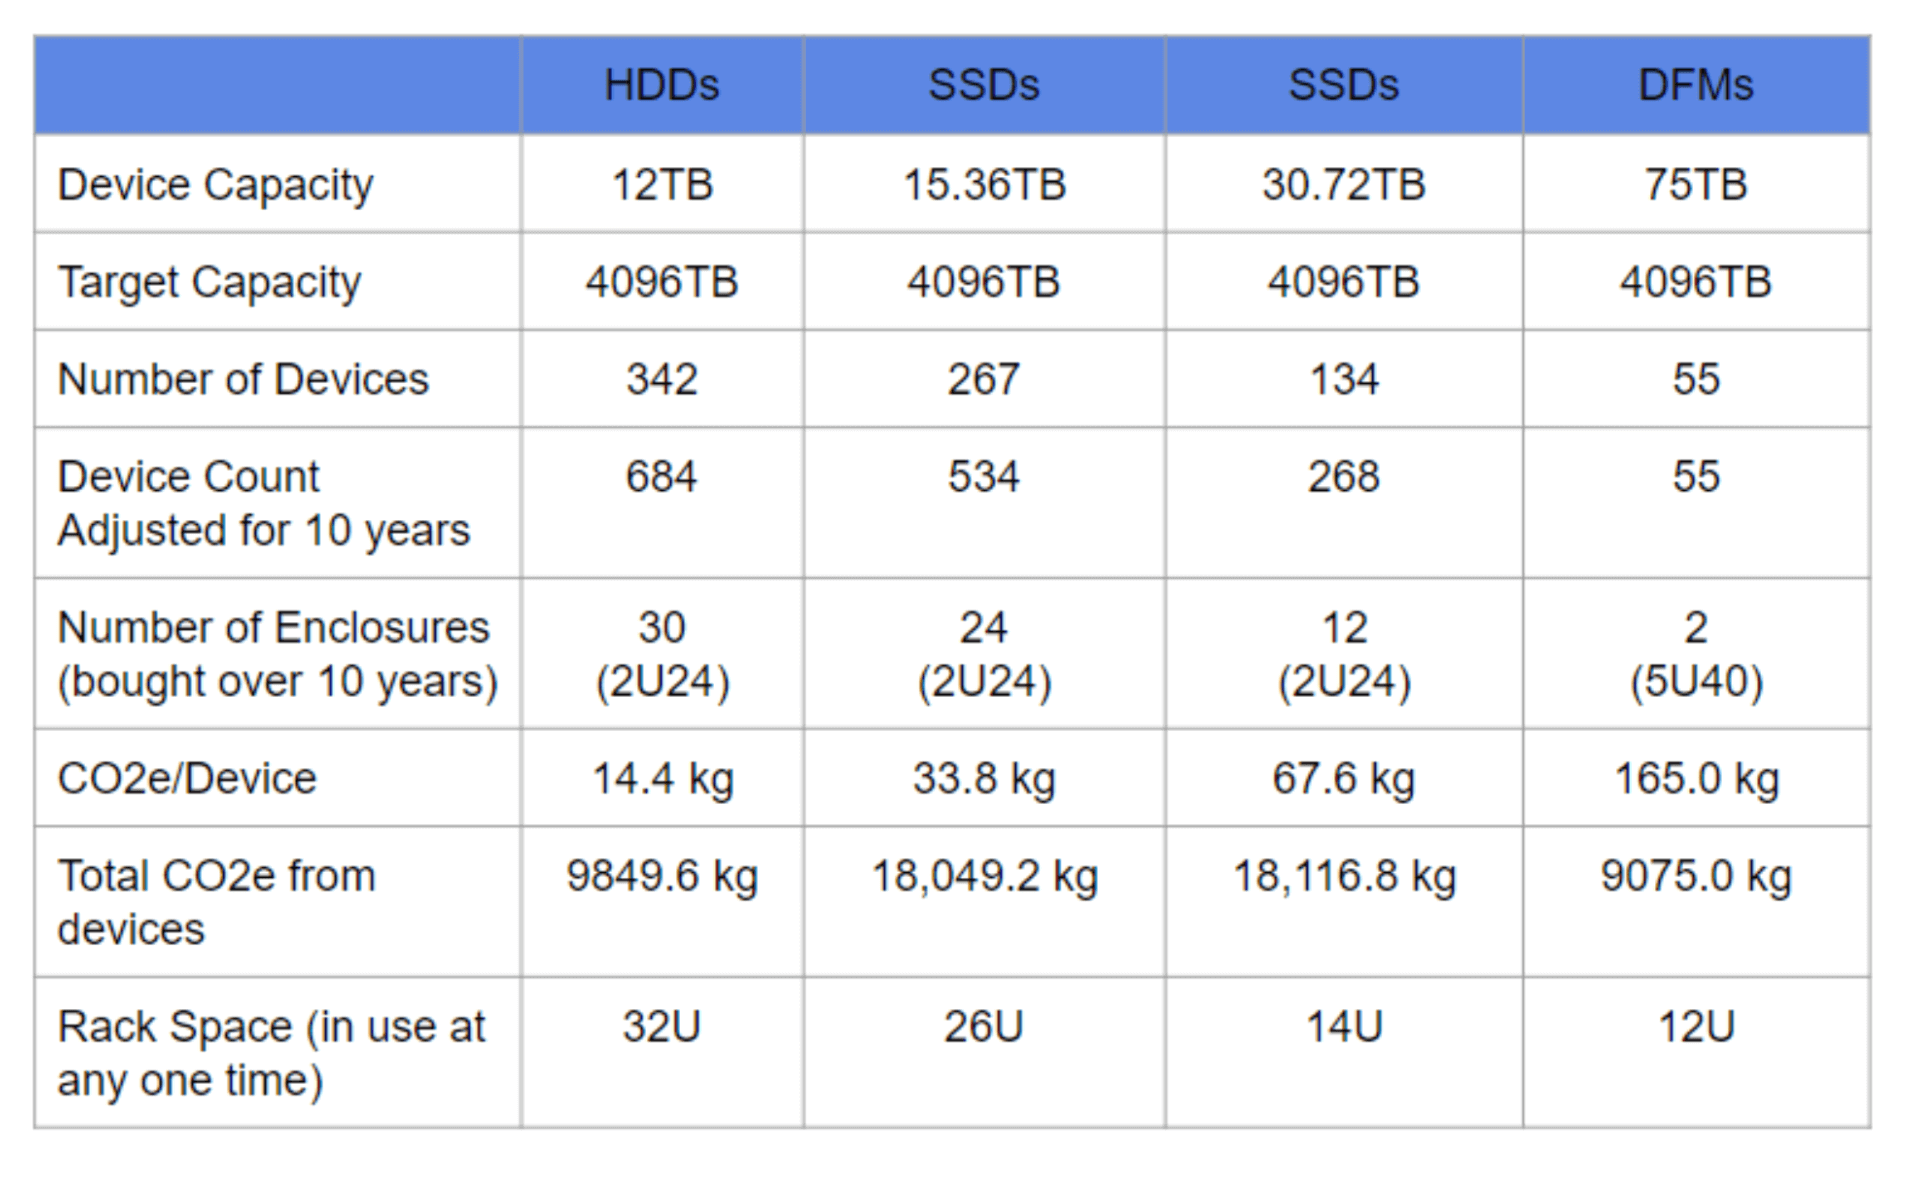
Figure 2 shows a comparison of systems built to meet a 4 petabyte requirement using 12TB HDDs and three different flash device options (15.36TB SSD, 30.72TB SSD, 75TB DFM)¹. To create Figure 2, I used the FY22 GHG emissions intensity ratios for spinning disk and flash for FY22 from Figure 1. CO2e and use-phase emissions are used interchangeably as per convention. You’ll note that just based on CO2e from storage devices, the SSD-based system is only 1.84x higher (not the 8x that has been implied in recent articles). This quick comparison does not take into account the additional components and enclosures required for the HDD-based system (all of which would add to its CO2e). [Note that I added in two 1U switches for the networking in each system type to get to the rack space requirement.]

Figure 2. A quick comparison of the storage device count and CO2e for enterprise storage systems using different device types.
I don’t want to get into a detailed comparison of life cycle energy consumption in this blog, but I would note that SSD-based systems can use far less energy than comparable HDD-based systems. A 12TB HDD pulls about 6 watts in average usage, yielding a TB/watt of 2.0. A 30.72TB SSD pulls between 9 and 13 watts depending on activity level. If we use an 11 watt assumption, that SSD yields a TB/watt of 2.8, about 40% higher than the HDD. For the comparison in Figure 2, the energy consumption for just the devices in the HDD-based system is 2,052 watts compared to 1,474 watts for the 30.72TB SSD-based system. It’s even lower for the 75TB DirectFlash® Module (DFM)-based system from Pure Storage. Our DFMs consume 10 watts, have a TB/watt of 7.5, and would drive energy consumption of 550 watts in the example given in Figure 2—about 75% lower than the HDD-based system. A more complete energy consumption comparison will be the topic of another blog, but it’s clear that when it comes to energy consumption and its associated CO2e, flash-based systems can offer big wins over HDD-based systems.
Now what about e-waste? If we use the 10-year comparison shown in Figure 2 for 12TB HDDs and 30.72TB SSDs, you have 2.55 the number of HDDs to dispose of. We’re assuming that both HDDs and SSDs operate under a five-year life cycle in systems (which might be generous for HDDs). So at the end of 10 years, you’d have disposed of 684 HDDs but only 267 30.72TB SSDs (not to mention having to buy and dispose of all the additional controllers, enclosures, fans, power supplies, and switching infrastructure you’d need for the HDDs).
System-level Use Phase Emissions
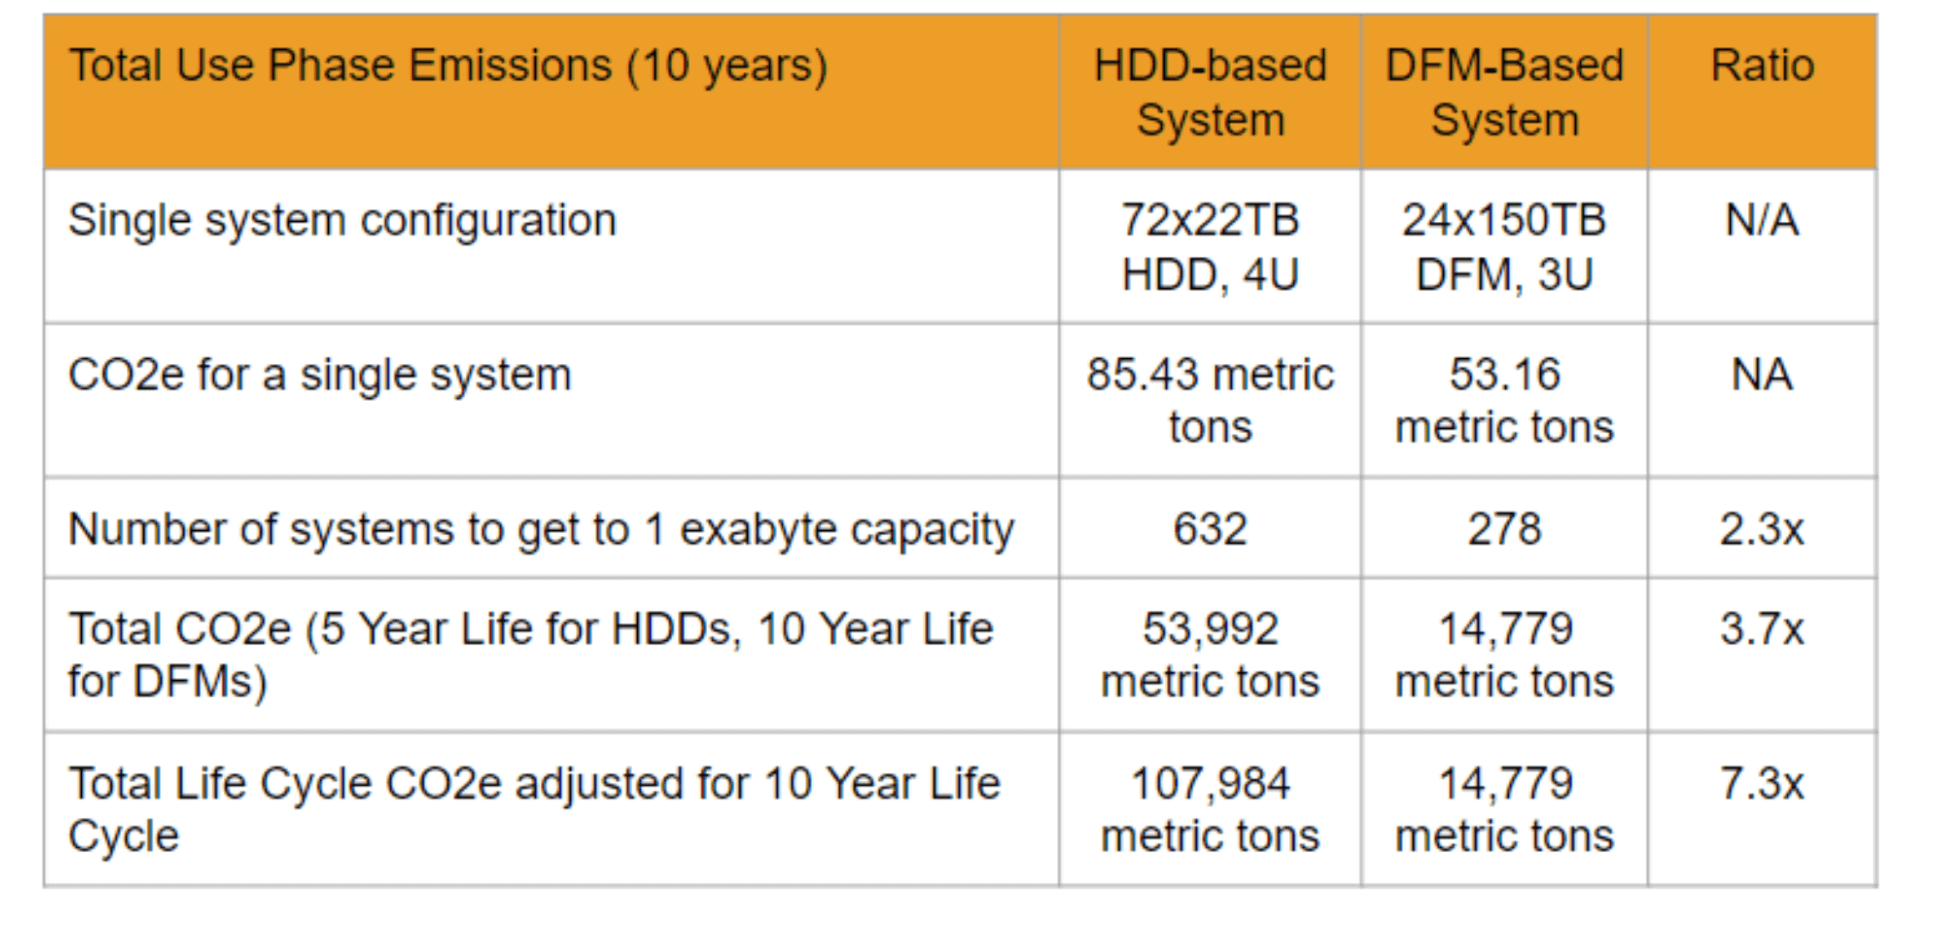
Let’s take another look at total use phase emissions for spinning disk and flash-based options. Western Digital’s FY22 Sustainability Report shows that the average HDD has use-phase emissions that are 1.2x higher than the average SSD. In Figure 3, I’ve compared HDD-based infrastructure using 22TB HDDs with a Pure Storage DFM-based infrastructure using the 150TB DFMs that will be shipping by the end of 2024 for a 1 exabyte deployment² over 10 years. I assume a 5-year life cycle for the HDDs (which may be generous) and a 10-year life cycle for the DFMs (which is proven out by Pure Storage’s own internal annual failure rates [AFRs] and endurance track records). So for the purposes of Figure 3, we are assuming that the HDD-based equipment must be purchased twice over the 10-year period, whereas the DFM-based equipment must only be purchased once. You’ll note that the HDD-based configuration has a total life cycle CO2e that is 7.3x higher than the DFM-based configuration.

Figure 3. CO2e comparison between a 1EB HDD-based vs. a 1EB DFM-based deployment over a 10-year period.
Any comparison changes depending on the size of devices you can use while still meeting performance, disk rebuild time, and other requirements, but it’s clear that if you can use larger devices you need far fewer of them. Particularly when it comes to HDD-based systems, many enterprises choose smaller device sizes to address rebuild and overall system performance concerns so more realistic comparisons might use 10TB or 8TB HDDs, further reducing the initial CO2e gap between SSD- and HDD-based systems. On the other hand, if performance and rebuild time requirements are very lax, you could use larger HDDs. 24TB HDDs are pretty commonly available today, and over the next several years we may see 30TB HDDs move to volume production. That would of course increase the initial CO2e gap between SSDs and HDDs.
Pure Storage DirectFlash Modules
Let me put a word in here about Pure Storage® DirectFlash Modules (DFMs). We decided almost a decade ago that to field the most efficient flash-based system we couldn’t rely on COTS SSDs—we’d need to build our own devices³. Unfettered by the limits of 2.5” SFF packaging technology, we’ve already shown that we can build extremely large capacity flash devices that are not only fully usable in enterprise systems but deliver more consistent performance, better capacity utilization, and have far higher density, reliability, endurance, and energy efficiency than COTS SSDs. While disk vendors often imply a 10-year life cycle for their SSDs, they actually only provide warranties in the range of five years. Our warranty on DFMs matches our life cycle analysis assumptions—10 years. And our DFMs cost less on a $/TB basis than COTS SSDs.
We’ve been shipping our 75TB DFMs since 2023, and I have included them in Figure 2. You can see that our higher DFM densities result in far more compact systems that need far fewer devices, less supporting infrastructure and rack space, draw far less power, and enable large-scale systems that can actually start at a lower CO2e than comparable HDD-based systems (depending on device capacities selected). We will be shipping a 150TB DFM by the end of 2024 and have plans to introduce a 300TB DFM by 2026. Those larger capacity DFMs will be very attractive for building multi-PB systems, while we’ll keep smaller capacity DFMs (which we are also shipping today) for use with our smaller systems.


Don’t Forget Reliability
There is a significant reliability difference between HDDs and SSDs. In Backblaze’s latest release in May 2024, they show average HDD AFRs at 1.41%. The latest available published Backblaze SSD AFRs are at 0.96%. Storage administrators know from experience that the AFR goes up as HDDs age. Yes, vendors will replace failed devices still under warranty, but the fact is that with HDD-based systems, administrators spend more time replacing failed devices and rebuilding data due to drive failures. Also, whether or not the manufacturer replaces them does not mean the replacement device has no CO2e impact—quite the opposite. Each replaced device is adding more and more embodied carbon to the total for the system.
Pure Storage DirectFlash Modules, by the way, are far more reliable even than SSDs. Our AFR is 0.12%, proven out across hundreds of thousands of DFMs we’ve shipped in systems since 2017—that’s 8x better than COTS SSDs’ latest AFRs!
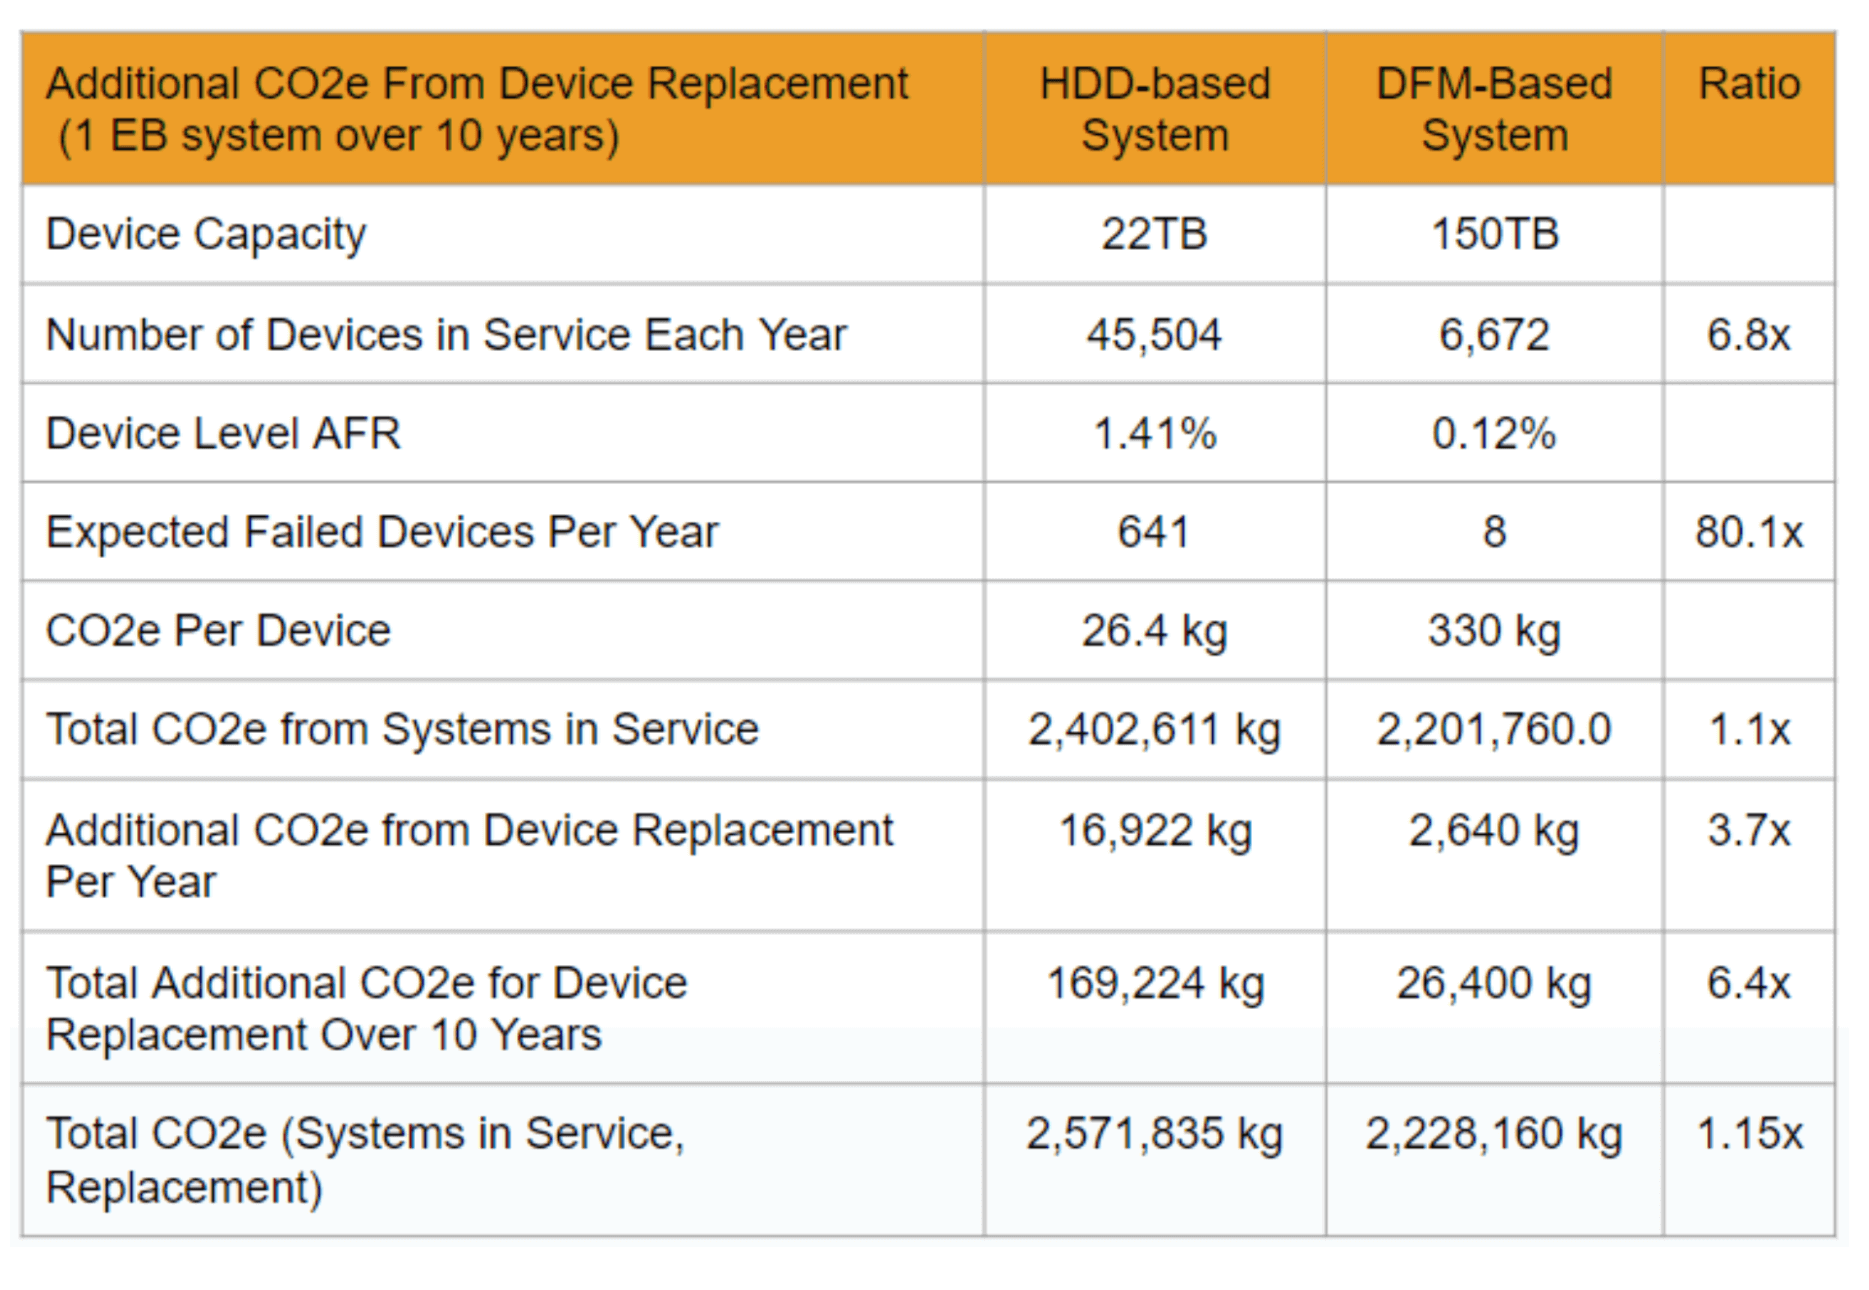
So just what is the additional CO2e incurred from a higher device failure rate? Figure 4 uses the assumptions of Figure 3 comparing a 1EB system built from 22TB HDDs vs. 150TB DFMs over a 10-year life cycle to show that the HDD-based system incurs an additional CO2e from replacement devices of 169,224 kg, whereas the DFM-based system only incurs an additional 26,400 kg, an over 6x difference. This addition makes a material difference when added to the overall CO2e of each system (the HDD-based and DFM-based systems).

Figure 4. Additional CO2e incurred for the 1EB configuration due to device failures.
Conclusion
So it’s clear that arguments that seek to encourage HDD-based systems purchases for enterprise use based on CO2e don’t really pan out if you look at the entire system over its life cycle. Improving flash manufacturing efficiencies have already narrowed the initial CO2e gap between HDDs and SSDs at the device level to less than 2x, and that will only continue to decrease as the GHG emissions intensity ratio for SSDs is coming down faster than it is for HDDs. And if you take useful life into account, that narrows (and sometimes) removes any CO2e difference. If you use storage systems from Pure Storage and evaluate CO2e across an enterprise storage system’s entire life—which I would strongly argue is the right way to evaluate it—it’s true that all-flash systems can have a lower embodied carbon impact than HDD-based systems.
Pure Storage solutions consistently beat HDD-based systems across a wide range of system-level metrics: overall performance as well as performance consistency, capacity utilization, density, reliability, endurance, cost/TB, energy efficiency, and life cycle. Recent articles trumpeting CO2e advantages for HDDs against flash sought to give enterprise customers reasons to continue to buy new HDD-based systems, but this analysis shows that systems built with SSDs have life cycle CO2e that is much closer to that of HDD-based systems than device-level comparisons would suggest. And large-scale storage systems built with Pure Storage DFMs actually have lower embodied carbon content not only across their 10-year life cycle but also at initial purchase. So again, like it was with cost/TB, COTS SSDs aren’t yet delivering capacities that threaten an extinction-level event for HDDs, but DFMs clearly are.
¹ The 75TB DirectFlash Module (DFM) is a flash storage device which is purpose-built by Pure Storage for enterprise use.
² This is based on current Pure Storage plans.
³ We delivered our first DFMs in 2017.
A More Sustainable Future
Learn more about Pure Storage’s commitment to ESG practices.


