This article originally appeared on Medium.com and has been republished with permission from the author.
Observability and diagnosability require collecting logs from a huge variety of sources, e.g. firewalls, routers, servers, and applications, into a central location for analysis. These logs help in troubleshooting, optimization, and predictive maintenance; all of which benefit from longer timeframes of log data. But the prospect of storing all log data for months or years inevitably results in enormous capacities. And to complicate matters, there are tradeoffs about how to best store and use the log data in a cost-effective manner.
I will contrast six different open-source storage formats and quantify their tradeoffs between 1) storage used, 2) access speed, and 3) transformation cost, as well as qualitative comparisons of simplicity and ease of use. Specifically, I will test with raw text and JSON-encoded logs, both with and without gzip compression, Parquet tables, and Elasticsearch indices. This is not an exhaustive study of all options, but rather a high-level survey of the tradeoffs.
Storage format tradeoffs come down to the ability to improve access to the data in the form of faster queries at the cost of increasing the amount of storage used and/or performing cpu-intensive transformations of the data. In other words, more expensive formats should make querying the logs faster.
Three questions help illuminate the tradeoffs for each format:
- How much capacity is required to store the data (and protect against hardware failures)?
- How quickly do simple search queries run?
- How much compute is required to create the data structures?
Regardless of the choice of data format, the log data can be stored on a filesystem or object store, depending on convenience. Pure Storage FlashBlade provides both a filesystem (NFS) and object store (S3), and for these comparisons both are equivalent. Importantly, the FlashBlade also performs inline compression for all data, reducing the actual capacity used for the uncompressed formats.
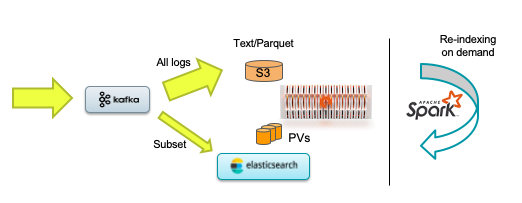
As the diagram below illustrates, the best architecture for a given use case is often a mix of formats, with all data stored in space-efficient formats (text/parquet) and a high-value subset being stored in Elasticsearch for quick accessibility. A scalable tool like Apache Spark then makes it easy to query or reindex logs. All of these choices, though, use the same storage infrastructure underneath: FlashBlade.
The Test Log Data
To test the various storage options, I generate 100 billion log lines using flog, a synthetic log generation utility that approximates apache weblogs. To give a sense of scale, the raw size of this dataset is approximately 10TB if stored on local drives.
And in case 100 billion sounds like an impossibly large dataset, it’s very likely that your environment is generating this much data already but it is not being captured anywhere. Doing quick mental math, 1000 devices generating 40 log lines per second equals 100 billion log lines per month! (That’s 1000 x 40 x 3600 x 24 x 30 = ~103Billion.)
You can easily generate some example data with the flog tool using the following command line and the public docker image:
Example lines look like this:
…
137.97.114.3 — — [27/Aug/2020:19:50:11 +0000] “HEAD /brand HTTP/1.1” 416 16820
252.219.8.157 — — [27/Aug/2020:19:50:11 +0000] “PUT /maximize/synergize HTTP/1.0” 501 4208
55.66.71.37 — — [27/Aug/2020:19:50:11 +0000] “POST /grow/extend/sticky HTTP/2.0” 302 15161
236.77.244.153 — powlowski5654 [27/Aug/2020:19:50:11 +0000] “DELETE /utilize/niches/envisioneer HTTP/1.1” 406 17658
6.183.162.152 — — [27/Aug/2020:19:50:11 +0000] “HEAD /generate/utilize HTTP/1.1” 502 11994
247.5.51.131 — — [27/Aug/2020:19:50:11 +0000] “PATCH /turn-key HTTP/1.1” 204 29950
…
As with most log data, there is a structured format implicit in these lines, but the actual data is simple text lines that need to be parsed to utilize the structure. For example, I may know (somehow) that the first item on each line is a client IP address, but that is not explicit in the log lines.
Structure is crucial for extracting meaning from the data and fortunately the flog tool also has an option to output logs in a JSON-encoded format. The data is the same, but it now also includes self-describing metadata:
> docker run -it --rm mingrammer/flog -f json -n 1
The ability to output self-describing log lines is not always available, but is becoming more common. The alternative is to manually create brittle parsing rules.
With the generated log dataset, traditional unix tools can be used for basic queries but suffer from single process limitations. For example, to find log lines with a specific username “simonis7813,” a simple grep works but takes nearly 3 hours on the 10TB dataset.
$ time grep “simonis7813” -r raw/
real 166m30.716s
While grep traditionally runs only on filesystems, it can also work with data on an S3 object store. One easy way uses the handy s5cmd’s ‘cat’ option:
> s5cmd cat s3://joshuarobinson/flog-* | grep simonis7813
Trying a more complicated aggregation query reveals just how poorly-suited single-threaded applications are for this scale of data. The following awk query counts the average value of one field based on a condition in a different field and takes 51 hours to complete!
> awk -F” |\”” ‘$7 == “PATCH” {sum += $12;cnt++} END {print sum/cnt}’ flog-*
Consequently, I will use open-source scale-out tools for the remainder of this analysis, focusing on Apache Spark and Elasticsearch.
Data Storage Formats
I will consider six different formats for storing my 100 billion log line dataset, each with different tradeoffs. All five file formats can be natively read and written by Apache Spark and the sixth format, Elasticsearch, can be accessed through a connector.
Raw text logs are the most straightforward, simply keeping logs as text files with the convention that each line is a log record. There is no explicit structure here, only what can be inferred by prior knowledge about the source logger.
Gzipped logs are compressed versions of the raw text logs. There are several popular compression choices, like lz4, zstd, or bzip2, with different levels of compression and performance, but I focus only on gzip here as it’s arguably the most widespread and is broadly representative.
Json logs are the same textual log information encoded in JSON format, creating a semi-structured set of fields per line instead of a single text sequence. While more verbose, the additional structure enables easier structured parsing of the log lines. JSON is optimized for human readability, a qualitative benefit not reflected in the later results.
Gzipped JSON logs are simply the JSON logs compressed by gzip.
Elasticsearch is an open-source, distributed, scale-out search engine and NoSQL database. Each log line is indexed, making flexible text searches very fast across individual fields or full log lines.
Underlying Storage: FlashBlade
The data formats above can be physically stored on a variety of underlying storage types, from local storage on flash or spinning disks to network-attached filesystems and object stores. For these tests, I store all the data on a FlashBlade, which gives the option of using either scale-out NFS or S3, although they are equivalent for all of these tests. In addition to scale-out performance for tools like Apache Spark, FlashBlade also performs inline compression, meaning that data stored in uncompressed formats ends up requiring less physical capacity on a FlashBlade.
Angle 1: Capacity Utilization
The first question is how much capacity is required to store the 100 billion log lines in each format. The total size of 9.5TB is the logical space required and represents how much capacity would be required on a basic local drive. But if those log lines were stored on a local drive then the data would not be protected against inevitable hardware failures, unlike FlashBlade.

The “Size on FlashBlade” column incorporates space savings from the FlashBlade inline compression. The “Reduction vs default” column shows how much more or less total space the data format on FlashBlade will require as compared to the raw uncompressed log data at 9.5TB, including compression of the file format and inline FlashBlade compression. All results focus on highly-reliable storage; the actual sizes on FlashBlade include the necessary overheads for protection against multiple hardware failures.
The best space savings comes from simply gzipping the original logs, but you can still achieve great savings with a format optimized for analytics on the data like Parquet. Even keeping the text logs without compression results in 43% of actual space consumed due to the inline compression of FlashBlade. This is beneficial in cases where you want to avoid the extra complexity of tooling to decompress before reading data.
Because flog randomly generates synthetic data, it actually shows a worse compression ratio than several internal log data sets which have more realistic, repeating patterns. From prior experience with real log datasets, the above compression numbers are close to worst-case on all formats.
Storage Consumption with Elasticsearch
Elasticsearch is the only storage format taking considerably more space than the original dataset, though of course with the best access performance as we will see later.
More details on how Elasticsearch sizes are calculated are as follows.
- Elasticsearch indexes each field separately when provided the JSON-encoded input. This enables constraining searches to specific fields, but results in larger index structures.
- Elasticsearch results include one replica shard, which is required in order to ensure data availability if an Elasticsearch node is down. This is because Elasticsearch assumes unreliable storage underneath it, i.e., local drives, and cannot today rely on storage level efficiencies like parity encoding for data protection.
- Individual indexes limited to 50GB (default setting) and used 20 shards per index. All default settings otherwise.
- Indexed 10% of the data and extrapolated the expected size for the full dataset.
There are techniques that reduce the total space usage of Elasticsearch; the above results are with the default settings which opt for flexibility instead of compactness.
The most impactful way to reduce Elasticsearch capacity is to change the default compression to “index.codec=best_compression,” which results in 37% less space required.
Force merging completed indices also rewrites them more efficiently. The following command reduces space consumption by 2.5%
curl -u “elastic:$PASSWORD” -k -X POST “https://quickstart-es-http:9200/filebeat-*/_forcemerge?max_num_segments=1"
Read here for more on storage requirements for Elasticsearch and filebeats.
Angle 2: Query Performance
Different data formats enable new ways to access and query log data; flat files require brute force searching, columnar encoding allows targeted queries to subsets of fields, and indexed data enables near constant-time lookups.
This section compares the performance of basic search queries, looking for a specific string corresponding to a username in the logs. These queries are logically equivalent to “grep simonis7813,” where “simonis7813” is the query string. As a basic test, I count the number of log lines that match the query condition.
I executed all queries with scale-out tools Apache Spark v3.0.1 and Elasticsearch v7.9.1 to run queries on a 5-node cluster with 16 cores per node.
The basic Spark query on raw log lines uses a filter operation:
sc.textFile(“/datahub/flogdata/raw/”).filter(lambda x: “simonis7813” in x).count()
The same query works against the gzipped version because Spark automatically detects and uncompresses the gzipped text.
And when running against structured data, a slight modification restricts the query to the “user-identifier” column only:
spark.read.parquet(“/datahub/flogdata/parquet”).filter(col(“user-identifier”) == “simonis7813”).count()
Because of the availability of schema in Parquet tables, these two queries are not equivalent. The second one is leveraging structure to only search within the field ‘user-identifier’ whereas the first is forced to search all fields. The structure enables more targeted searches, requiring less IO work and avoiding false positive matches.
And for Elasticsearch, I use curl to issue the query as follows:
curl -u “elastic:$PASSWORD” -k “https://$ELASTIC_HOST:9200/filebeat-*/_count?pretty" -H ‘Content-Type: application/json’ -d’{“query”: {“term”: {“user-identifier”: “simonis7813”}}}’
Results
The results show orders of magnitude difference amongst the data formats:
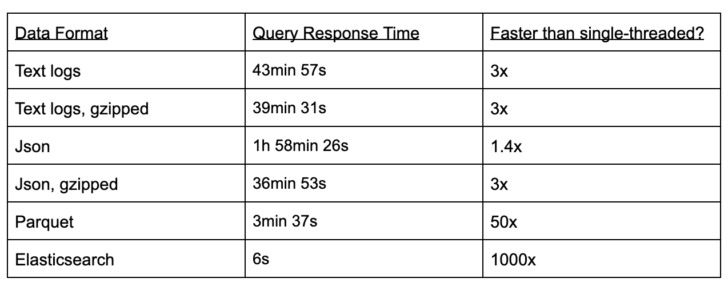
The third column above compares each of these test results to the original ‘grep’ result, which is heavily optimized but limited to a single node.
Broadly, the results show that PySpark queries on flat (text/json) files are 3x faster than basic grep, queries against Parquet are an order-of-magnitude faster, and Elasticsearch is another order-of-magnitude faster.
Classic grep performs surprisingly well relative to the PySpark version with 5 nodes. These queries are not CPU-intensive, therefore are node-bound, i.e., limited by throughput to the CPU, not the work done by the CPU. The use of Python and the JVM in PySpark also slows down the scaling relative to the highly-optimized ‘grep’ binary.
Spark does have the advantage of being trivial to linearly scale; the response time can be halved simply by doubling the number of Spark workers. The real advantage of PySpark is not raw speed, but theflexibility to quickly create more complicated queries.
As a concrete example, it took me longer to write the awk query used for aggregation than it took to write and run the query (shown later) against a Parquet table using PySpark. Simplicity is a qualitative advantage that should not be underestimated.
Elasticsearch queries ran on 1/10 the full log dataset (i.e., 10 billion documents) due to resource constraints, but results were taken over various sizes to verify the query response time was roughly constant above one billion documents. The Elasticsearch queries ranged from 1.5s to 8s and were always run with caches cleared. Further, there was no runtime difference between structured (JSON) and unstructured (text) Elasticsearch records.
Putting Structure on Raw Logs
Comparing search queries on the various data formats exposes how the availability of structure or schemas impacts these queries. Traditional raw text log lines have implicit structure, for example based on spaces or commas in each line, but not explicit structure like JSON or Parquet. This means that queries on raw text logs cannot be constrained to specific fields like with semi-structured data.
Searching through the raw version of the logs does not allow restricting the query to just certain fields or to apply non-text comparisons like numerical cutoffs. I repeated the grep filter in Spark but included a pre-processing step to add structure to the log line by treating the line as a space-delimited row:
spark.read.option(“delimiter”, “ “).csv(“/datahub/flogdata/raw/”).filter(col(“_c2”) == “simonis7813”).count()
The resulting processing time was the same as without this basic parsing, indicating that IO is the bottleneck, not CPU. In order to take advantage of structure, it needs to be incorporated into the data layout on storage, as with Parquet and Elasticsearch. Further, ad hoc parsing rules like this are brittle and therefore become technical debt in a log analytics pipeline.
Partitioned tables offer another key type of structure for analytics not explored here: organizing the data based on a specific column so that queries that filter on that column are more efficient. The most common type of partitioned table is based on dates, allowing Spark to only search through log data in a given time range.
Finally, the timing results held across filter and aggregation queries as well, suggesting that these trends follow for any IO-bound query.
Angle 3: Transformation Cost
With the exception of the raw text logs, there is an additional CPU cost in transforming the original log data into the storage format of choice. In addition to capacity required, this is an important element of the cost for each storage format. There are many different ways to improve performance of these transformations, so these results focus on broad trends only.
The measured relative costs of transformation are compared in the table below, measured in lines/sec on the same nodes with previous generation CPUs.

The main takeaway here is that full indexing of log data is significantly more expensive than other formats.
The transformation to Parquet requires reading from the json-encoded logs in order to inherit the field structure. Simply reading the JSON takes ¾ of the overall time, as validated by simplifying counting the number of records in the JSON files.
Further, note that importing JSON with Spark takes significantly longer if you do not explicitly specify the schema, otherwise Spark tries to infer the schema via expensive checks on each record.
For Elasticsearch, the JSON-encoded inputs are slightly more expensive to index because each field has a separate index, but the results are averaged together to illustrate the orders of magnitude differences between options.
Transformations to Parquet or Elasticsearch can be easily set up using Kafka and connectors, for example Kafka Connect to periodically write in Parquet format to S3 and filebeats to read from Kafka, filter, and ingest into Elasticsearch. I purposefully examined storage formats that do not require custom coding to transform or use.
Summary
Collecting qualitative results from each angle into a single table highlights that there is no clear best choice but rather clear tradeoffs in terms of cost and usability.
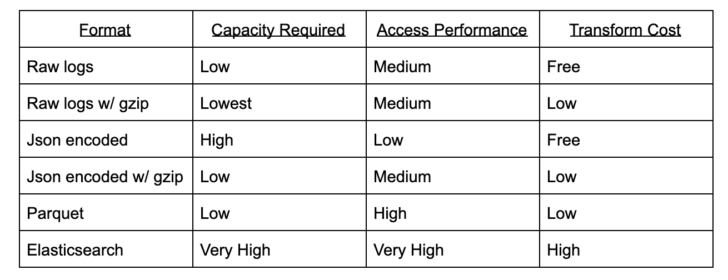
With performant storage, you can store all logs in a space-efficient format like Parquet or zipped logs, and then index subsets to Elasticsearch on-demand if rapid access is needed.
Recommendations:
- Keep all log data in gzipped or columnar (Parquet) formats depending on if field structures are available.
- Query the processed logs using scalable open-source tools like Apache Spark.
- Filter and index a high-value subset using Elasticsearch.
- Use Apache Spark to read the historical logs and push to Elasticsearch if that high-value subset changes.
In fact, the only format that does not have a good tradeoff point for storage is the JSON-encoded version of the log files, except that this is a very useful intermediate format for logs that will eventually be converted to structured formats like Parquet or Elasticsearch. There are more compact alternatives, like Avro, but the human-readability of JSON has many qualitative advantages, for example in debugging.
This mix of options creates a flexible log analytics system. The most valuable log lines can be kept in Elasticsearch, where they can be retrieved interactively in seconds. Storing all logs in a compact format (like raw gzip, or Parquet), you have moderate accessibility for querying the data and also the ability to re-ingest the logs into Elasticsearch to improve accessibility. A high performance storage substrate like FlashBlade enables all datasets to be stored on the same device with the ability to easily shift capacity between different formats as needed.

Pure1® Assessments
Take the Virtualization Assessment
Pure1 can help optimize virtual environments and reduce costs.

Written By:


