Sustainability and energy efficiency are key differentiators between Pure Storage and the competition. In fact, we recently found that we can save customers up to 85% carbon energy consumption over other flash storage vendors (and even more against spinning disk arrays). You can read all the great details in our 2024 ESG Report. Thanks to our ultra-dense and efficient flash storage appliances, we can help you save on overall data center footprint and drive down expensive power and cooling requirements further. However, Pure Storage isn’t just about being ultra-efficient; we’re also about being ultra-transparent. That’s why we’re introducing a brand-new Sustainability Assessment exclusively inside a tool you already own: Pure1®.
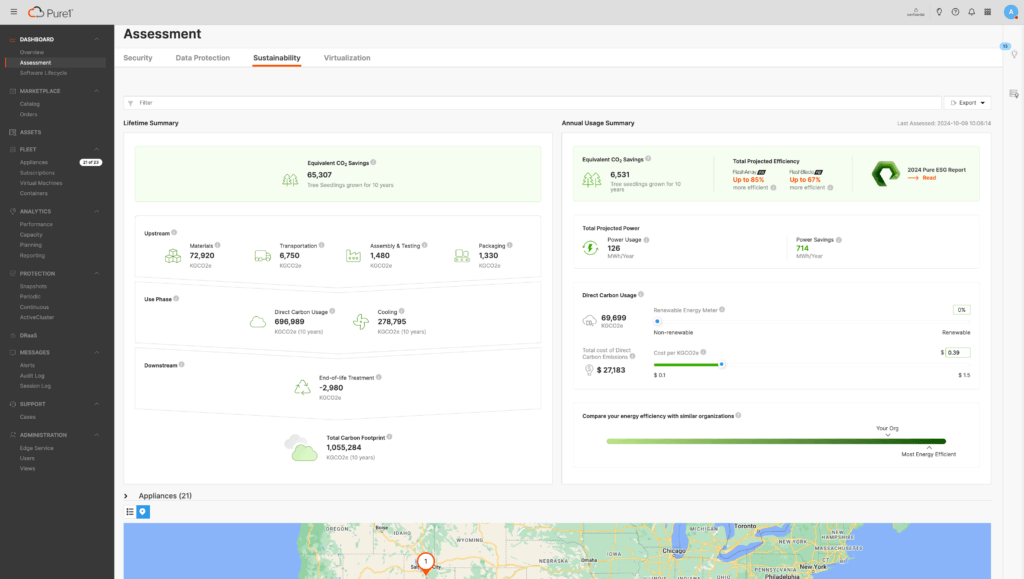
Figure 1: Scope 2 and Scope 3 emissions summaries in the Sustainability Assessment.
The new Pure1 Sustainability Assessment is all about providing transparency in how your Pure Storage all-flash appliances are operating. Choosing Pure Storage as your storage platform is a fantastic first step toward reducing your overall carbon footprint, and the Sustainability Assessment is designed to help you get the most out of it.
What’s in the Pure1 Sustainability Assessment?

Figure 2: Viewing appliances in the Sustainability Assessment.
The Pure1 Sustainability Assessment delivers at three main levels: your overall energy and carbon usage across your entire organization, your consumption at the data center location level, and consumption at the individual array level. Whether you’re providing high-level metrics to your environmental, social, and governance (ESG) teams or looking for actionable ways to reduce your overall energy needs, the Pure1 Sustainability Assessment is your go-to resource.
Figure 3: Appliance details.
Each of your Pure Storage flash appliances is represented in a color-coded map that highlights where your greatest savings opportunities can be found.
Figure 4: Recommendations in the Sustainability Assessment.
Clicking on one or more appliances will bring up actionable insights which include adding more workloads to better utilize the hardware or areas where you could gain greater efficiency through upgrades.
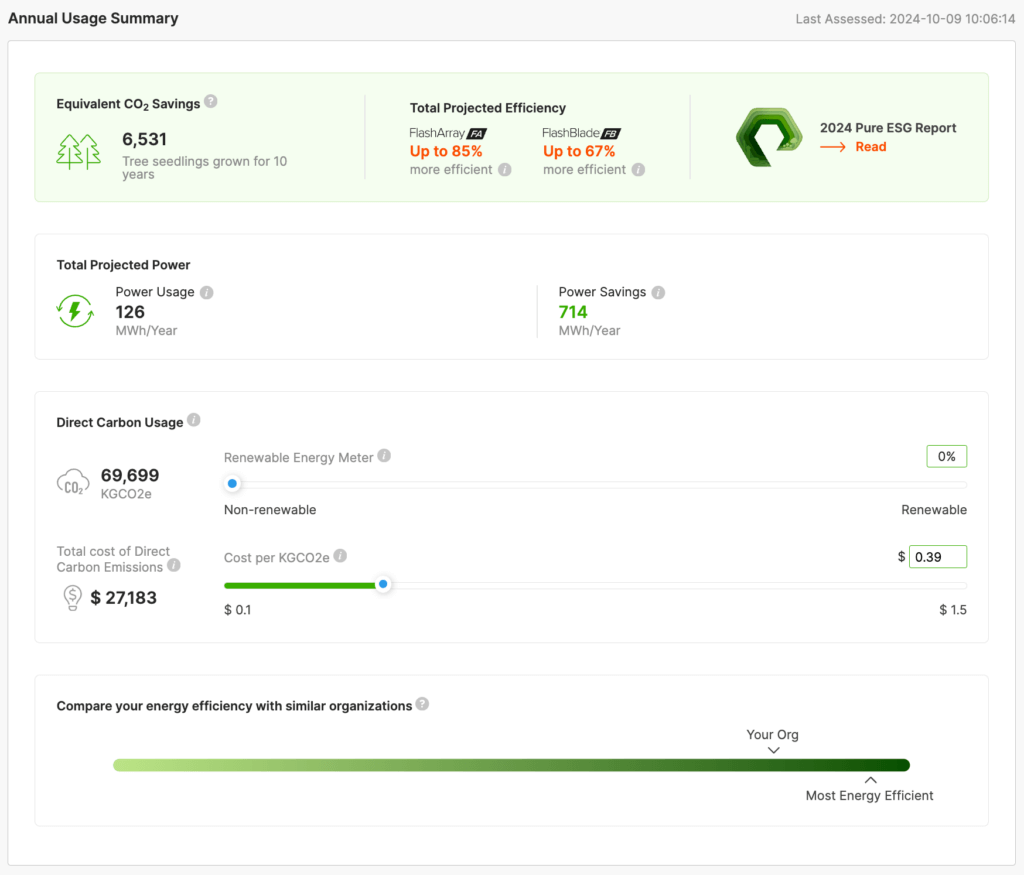
Figure 5: Annual consumption projections.
The annual summary provides you with an overall view across your entire organization. Using your current consumption rates, we’re able to project your expected annual usage, both in terms of power consumption and your direct carbon usage based on Intergovernmental Panel on Climate Change calculations. The latter of which can be adjusted based on the percentage of renewable energy used to power your sites.
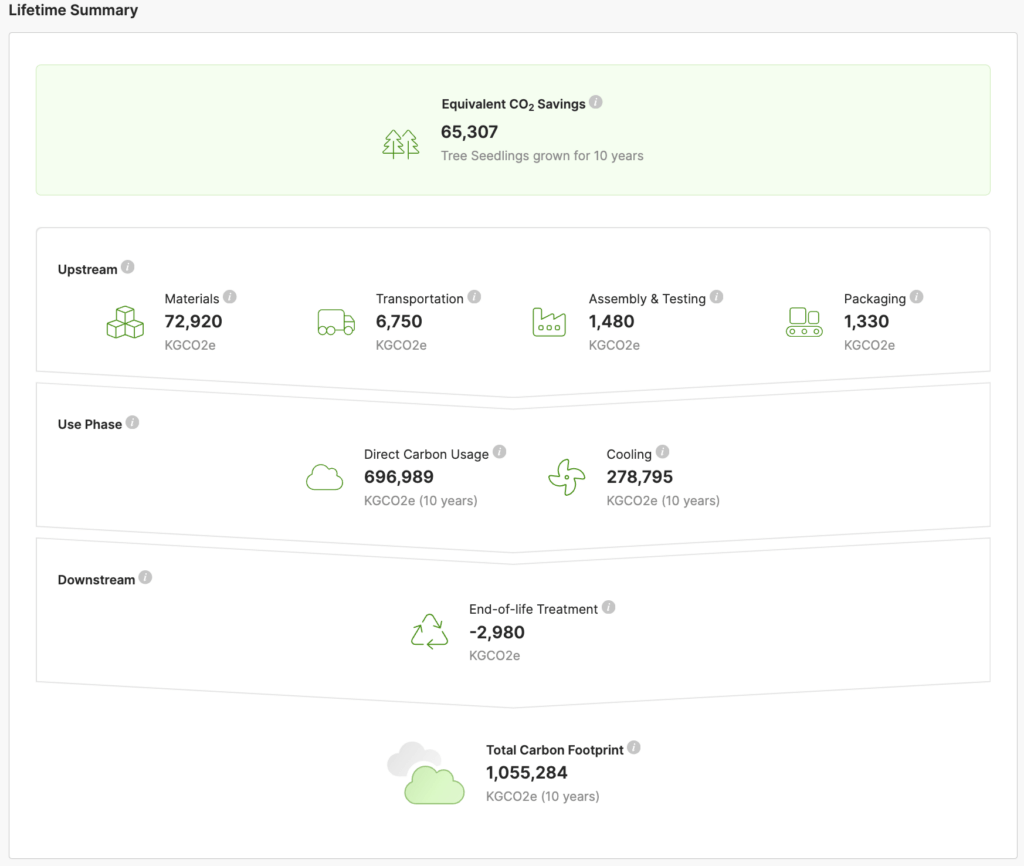
Figure 6: Scope 3 emissions summary.
In addition to energy and carbon usage tracking, the latest update to the Pure1 Sustainability Assessment now includes a comprehensive view of Scope 3 emissions. This enhancement allows you to evaluate the environmental impact of your Pure Storage arrays throughout their entire lifecycle, from production and transportation to operation and eventual disposal. Understanding these indirect emissions provides a deeper, more holistic picture of your organization’s carbon footprint and helps you align more closely with corporate sustainability goals. By incorporating Scope 3 data, you gain the ability to make informed decisions that further enhance your ESG profile and support long-term environmental stewardship.
Figure 7: Peer rating comparison.
To further support your sustainability efforts, the Pure1 Sustainability Assessment includes a peer rating system that compares your energy efficiency with similar organizations. This feature clusters customers based on factors such as fleet size, workload, and usable capacity, providing a clear benchmark of where your organization stands against your peers. By understanding how your efficiency measures up, you can set realistic goals and take actionable steps to improve your ESG performance. The peer rating system serves as a valuable tool in guiding your journey toward greater energy savings and reducing your environmental impact.
Figure 8: Global view of data center distribution.
If you have storage distributed across multiple sites, the data center view will provide a better understanding of where your largest energy costs are.
Figure 9: Data center summary.
For data center metrics, you’ll see peak and actual power consumption metrics. Peak metrics are based on Pure Storage’s benchmarks representing the upper boundary of what your hardware could draw, whereas the actual power metric represents your current power draw. Generated heat is calculated based on the peak and actual power metrics. You’ll also get a great summary of recommendations for each data center.
Figure 10: Additional array-based metrics.
There are several additional metrics at the appliance level such as the nominal power and heat value. Like the peak metrics, these metrics are also based on Pure Storage’s hardware benchmarks representing an average power draw (again, heat is calculated using power). We provide these metrics to give you a barometer to measure your actual usage against.
In addition, we include a capacity overview to give you an idea of how efficiently you’re using each of your arrays. Could you be utilizing your storage better to improve your data reduction ratios (DRR) or rebalance your workloads and consolidate? Better utilization will also drive down a new hero metric called watts per terabyte. This represents your actual power consumption based on used storage before deduplication.
Array information, such as model numbers and software versions, is also included in the Sustainability Assessment. You can use it to identify aging hardware or arrays that may not have the latest performance-enhancing software updates. There’s even information about the number of shelves and total number of rack units consumed by each appliance. Are you tying up RUs that could be saved by upgrading to newer, more dense hardware (with zero downtime)? This will tell you.
There’s a ton of useful information in this initial release to help cut down on your energy consumption and costs. In the very near future, Pure1 will be able to provide you with actionable recommendations that you can take to drive up your efficiency. So don’t just take our word for it, see how your Pure Storage appliances compare to the competition and start saving a whole lot of green.
Check out documentation on the Pure1 Sustainability Assessment (login required).


Written By:
A Greener Future
Learn more about how Pure can help you save money and the planet.


