Organizations are looking to get operational visibility across their whole IT stack—to get real-time data from all their systems into their observability platform to get actionable insights. To provide that data for the Pure storage environment, Pure Storage® now offers a unified app and technical add-on that enables you to import log and metric data into Splunk. You can then use it to simplify array monitoring and analyze FlashArray™ and FlashBlade® devices from a single pane of glass using the Splunk platform.
The Pure Storage Unified App allows you to visualize your Pure storage inventory, monitor capacity, and audit usage. You can set up alerts to notify you of events that may need your attention. The new unified add-on adheres to the Splunk app’s certification requirements by mandating a secured connection between Splunk and the clients. It also streamlines the connectivity to FlashArray and FlashBlade devices by using API tokens.
Overview
The Splunk Enterprise platform allows you to import and index data from various sources. Features like searches and analysis enable you to turn that data into action. Splunk extends and enhances the value of its platform with third-party apps and add-ons that allow users to “get data in” from specific sources and visualize the data.
The Splunkbase library has hundreds of apps and add-ons built by the company, partners like Pure, and the user community. The apps and add-ons offer optimized data-collection tools and powerful dashboards right out of the box for enterprise security, IT operations, mobile intelligence, and more.
Apps provide powerful visualization through an intuitive user interface to help you get the most from your data. They generally include pre-built dashboards, reports, alerts, in-depth data analysis, and more.
Meanwhile, technical add-ons (TAs) are reusable components that perform functions to enable apps and onboard data from a particular source. They also help select, identify, and tag fields and map them to standard models to prepare them for analysis or use in apps.
Splunk Apps Use Case with Pure
Many organizations that use FlashArray and/or FlashBlade to host their critical applications also use Splunk for monitoring. The monitoring platform provides proactive response, supports their security information and event management (SIEM), improves operations, and helps with issue identification and troubleshooting. A key requirement of an effective monitoring platform is having all relevant machine logs and metrics from various infrastructure and applications in a unified platform.
One common way to get this data is by configuring syslog servers and pointing Splunk to the syslog server. Pure FlashArray offers the functionality to forward logs to a syslog server (FlashBlade offers syslog functionality starting with version //FB 3.1). At this time, the array can only forward alerts and audits to the syslog server.
What if you wanted to:
- See all the FlashArray volumes and analyze your space usage over time?
- Identify the top 10 volumes by bandwidth or latency within the last 24 hours?
- See the top FlashBlade filesystems or object stores by capacity used within the last three hours?
This is exactly what the Pure Storage Unified App for Splunk offers and even more. The app provides information for both FlashArray and FlashBlade, including the following:
- FlashArray: Various entities like volumes, volume groups, pods, hosts, snapshots, protection groups, audits, alerts, and performance metrics at the array, volume, and pod level
- FlashBlade: Filesystems, snapshots, object store, audits, alerts, and performance metrics at the array, filesystem, and object-store level
The information is extracted from FlashArray and FlashBlade devices using their respective REST APIs.
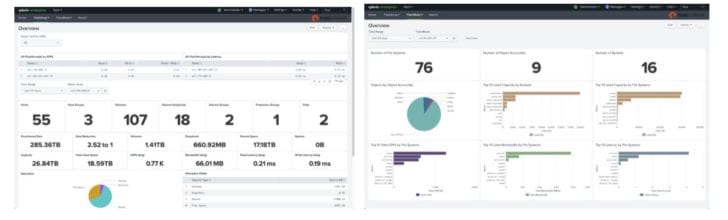
Figure 1: Dashboards with performance metrics for FlashArray and FlashBlade.
Pure Storage Unified App and Add-on for Splunk
Over the past four years, Pure has developed standalone apps and add-ons for FlashArray and FlashBlade. So, it was time for an update. We’ve included new product features, as well as made the app compatible with Python 3. We also took this opportunity to consolidate FlashArray and FlashBlade within the same app to make life easier for our customers. Now there’s just one app to manage. It also helps you follow a better release cycle.
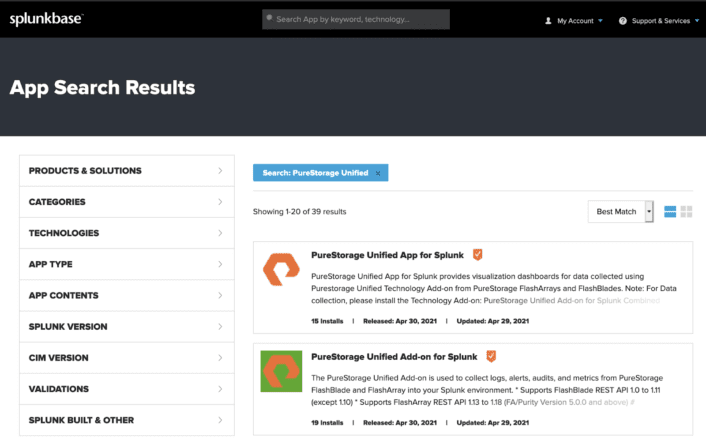
Figure 2: Pure Storage Unified App and Add-on for Splunk in the Splunkbase library.
The Pure Storage Unified Add-on addresses security by standardizing the connectivity to FlashArray and FlashBlade by API token. It also adheres to Splunk’s app certification requirements that require a secured connection between the Splunk instance and the clients. The Unified Add-on no longer allows an unsecured connection as an option. Learn more about it in our knowledgebase article.
As you can see from the architecture diagram (Figure 3), you can install the Unified Add-on for Splunk on the heavy forwarder. Every FlashArray and FlashBlade device is configured as a separate input. Once you’ve configured the add-on, Splunk invokes the data-collection module individually for every appliance at the configured interval.
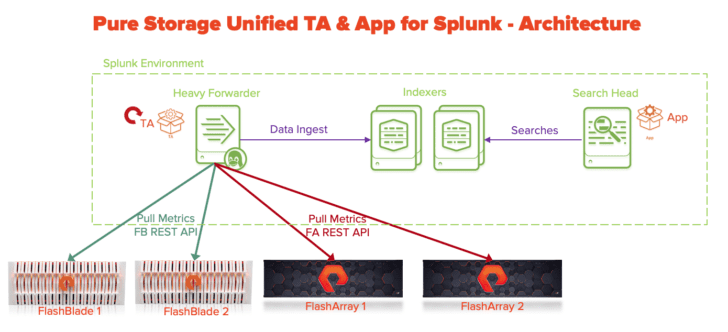
Figure 3: Architecture of the unified technical add-on and application for Splunk.
The Pure Storage Unified App offers the following dashboards for FlashArray and FlashBlade:
Unified App
-
- Overview (single-pane view of FlashArray with a summary of alerts and capacity)
- FlashArray
- Overview (list of all FlashArray devices with drill down, along with top 10 volumes by latency, IOPS, and bandwidth)
- Storage (detailed level view)
- Volumes
- Hosts
- Volume Groups (new in this version)
- Protection Groups
- Pods (new in this version)
-
- Analysis
- Array (performance metrics at an array level)
- Volume Metrics (at a volume level within an array)
- Volume Groups (performance metrics at volume group level within an array)
- Pods (performance metrics at a pod level within an array)
- Health
- Alerts
- Audits
- FlashBlade
- Overview (summary information of a FlashBlade device, along with top 10 filesystems by IOPS, bandwidth, and latency, plus top 10 capacity used by filesystems and buckets)
- Storage (detailed level view)
- File Systems
- Object Store
- Protection
- Policies
- Analysis
- Performance (performance metrics with drill down at the FlashBlade level, along with protocol)
- Capacity (capacity usage for a selected FlashBlade)
- Health
- Hardware
- Alerts
- Analysis
- Audits (new in this version)
Check out this article for more information on the unified app and add-on. See how to install them in a standalone or distributed environment and get step-by-step configuration instructions for the add-on.
![]()