Both input/output operations per second (IOPS) and throughput are very important metrics for measuring data storage performance for hard drives (HDDs or SSDs) and storage area networks. However, they each measure different things and there are various factors to take into account for both of them. Here, we are going to closely examine IOPS vs. Throughput.
If you want to skip right to how Pure customers are using FlashArray™ in terms of reads and writes based on IO input data from across the entire FlashArray fleet deployed across thousands of customers, click here.
If you feel you could use a refresher on IOPS and throughput and how they’re calculated, read on.
What Are IOPS and Should You Care?

Try FlashArray//C™
Capacity-optimized, All-flash Storage
Get enterprise-class performance, reliability, and agility at an accessible price.
What Is IOPS and How Do You Calculate It?
IOPS, pronounced “eye ops,” is the measurement of the number of input/output operations a storage device can complete within a single second. It’s a standard performance benchmark for solid-state drives, hard drives, flash drives, and network attached storage (NAS) devices.
An “input” is any information sent into a computing system via an external device, such as a keyboard or a mouse. An “output” is the response to or result of processing the data that came from the input.
An input is considered a “read” operation because the computer is reading the data and putting it into its memory, and an output is considered a “write” operation because the computer is transferring data by writing it to somewhere else.
Calculating IOPS can be tricky because so many factors go into determining throughput and performance. The type of drive is also a factor, so an SSD will have a different calculation compared to an HDD of the same size. The type of RAID used in an array will also be a factor because some RAIDs will carry a performance penalty. For example, RAID 6 has a much higher penalty than RAID 0 because it must distribute parity across all disks.
Generally, the basic calculation for IOPS is:
(Total Reads + Write Throughputs) / Time (in seconds)
What Is Throughput and How Do You Calculate It?
Throughput is a measure of the number of units of information a system can process in a given amount of time. Throughput is most commonly measured in bits per second (bit/s or bps), but may also be measured in bytes per second (8 bits per byte) or data packets per second (p/s or pps).
IOPS vs. Throughput: Which Should You Use to Calculate Performance?
Throughput and IOPS are interrelated but there is a subtle difference between them. Throughput is a measurement of bits or bytes per second that can be processed by a storage device. IOPS refers to the number of read/write operations per second. Both IOPS and throughput can be used together to describe performance.
In fact, there are three factors that must be combined to tell the full story of storage performance: bandwidth rate, latency, and IOPS. Most storage vendors tend to focus on IOPS to brag about how fast their storage system is. But measuring storage system performance by IOPS only has value if the workloads using that storage system are IOPS demanding.
IT professionals often use IOPS to evaluate the performance of storage systems such as all-flash arrays. However, looking at IOPS is only half the equation. Equally important is to look at throughput (units of data per second)—how data is actually delivered to the arrays in support of real-world application performance. So in short, you should use both.
When speed matters, the amount of data that can be written and read from a storage device is an important factor in performance. For individual devices, the difference in IOPS might be negligible for performance, but in a data center and enterprise environment, the amount of bytes that can be read and written to storage will affect performance of your customer applications.
Using throughput only isn’t the whole picture, though. Latency also plays a part in storage performance, and it refers to the time it takes to send a request and receive a response. The device mechanics, controllers, memory, and CPUs can also have an effect on latency. All these factors go into the performance of a system.
Related reading: Thick-provisioned IOPS in the Public Cloud
IOPS HDD vs. SSD: A Look at FlashArray Devices
SSDs and HDD devices are built very differently. An HDD stores data on spinning platters, while an SSD is circuits with no moving parts. Because physical limitations restrict the speed at which HDD platters can spin, HDDs do not have the high-speed throughput of an SSD. Read and write actions on an HDD depend on the spinning speed of platters, so they’re often used for storage where reads and writes are not common.
For example, HDDs are affordable for backup storage. For active applications, SSDs are commonly used since they offer faster IOPS. Circuits can transfer data faster than a physical spinning device, so an SSD will always be the preferred storage solution for enterprise applications with numerous reads and writes.
IO Reads vs. Writes: How Pure Customers are Using FlashArray
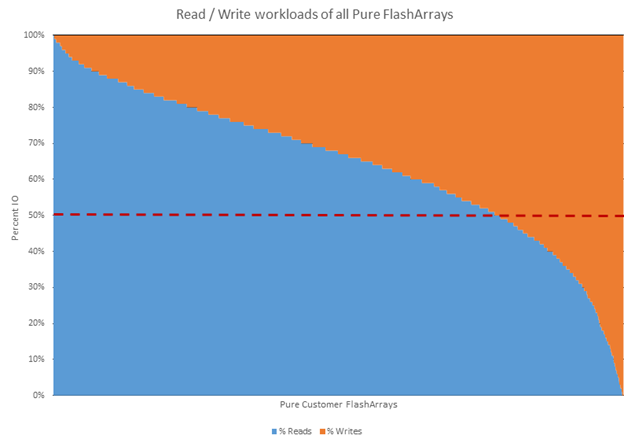
Let’s start with the simplest question first: Are customers using the FlashArray device more for reads or writes? Is it 50/50? There are some who fall into each of these categories. Some FlashArray devices are 100% reads and some are 100% writes though such extremes are rare. The vast majority of FlashArray devices run a mix which favors reads over writes.
The median distribution is ⅔ reads and ⅓ writes, with 78% of customer arrays running workloads that have more reads than writes. Figure 1 below shows the read/write distribution across all customer Pure Storage® FlashArray devices.

Figure 1. The distribution of reads / writes across all customer Pure FlashArrays. The y-axis shows the percentage of each. The x-axis represents all the customer arrays sorted from those that do the most reads to those that do the most writes.
Why Most Customers Have More Reads than Writes: 78%
A read is when a user requests for data to be retrieved from a storage device, and a write is the action of writing ones and zeros to disk for future retrieval. Writes happen when the server sends data to the storage device, but reads are much more common on enterprise servers where applications retrieve data and cache it in memory where it can be retrieved. Backup devices and database storage might have more reads than a standard application server, so make sure you know the server’s purpose before determining IOPS importance.
Why Customers Have More Writes than Reads: 21%
Writes are common when users store data more than retrieving it. A database server might have many writes per second as users store data to it. Backup servers are mainly used for writes where users store their data but rarely need to retrieve it. Backup server storage devices are optimized for writes to speed up performance, which is especially necessary when terabytes of data must be backed up every day.
Why Some Customers Have All Writes: 1%
In some mirrored environments, you might have the mirrored storage for failover only. In these instances, you would have all writes with no reads if the primary disk never fails. You may eventually have reads if the primary disk fails, so you should still ensure that read performance is sufficient for temporary usage while the primary disk is repaired.
Why IO Read vs. Write Distribution Matters
Why does it matter whether customers are using reads vs. writes?
In most critical enterprise applications, reads and writes are discovered when analyzing the software. Analysts might find that an application writes a large percentage of the time versus reads on data from storage. The storage system must be able to prioritize writes over reads. This doesn’t mean read performance can be completely ignored. Enterprise systems need storage devices that have fast reads and writes, but the device installed on a critical server should be optimized for either reads or writes to keep performance at its best.
IO Size vs. Throughput: An Analysis of FlashArray Devices
We learned that Pure customers tend to do more reads than writes. What’s the most common size at which they do these reads and writes?
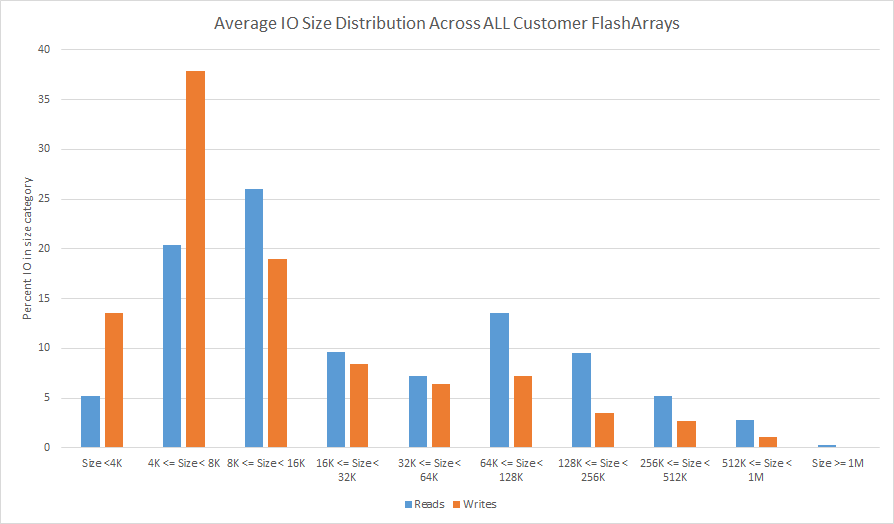
Let’s start with a very direct approach by looking at the distribution of IOs for every customer FlashArray based on the different size buckets. Then let’s average these distributions for all the customers. This way we learn what on average are the most common IO sizes across all customers. This is shown in Figure 2 below.

Figure 2. The average of all customer array’s IO size distribution.
We see that the two most popular sized buckets for reads are 8KB to 16KB and 4KB to 8KB respectively. For writes, the most popular size is 4KB to 8KB.
By looking at the distribution of IO sizes on an individual array basis, we see that the majority of arrays are dominated by IOs which are small in size:
|
Majority of IOs < 32KB | Majority of IOs < 16KB | |
|
Reads | 73% of arrays |
56% of arrays |
| Writes | 93% of arrays |
88% of arrays |
However, looking at IOPS (IOs per second) is only half the equation. Equally important is to look at throughput (bytes per second)—how data is actually delivered to the arrays in support of real-world application performance.
We can look at IO size as a weight attached to the IO. An IO of size 64KB will have a weight eight times higher than an IO of size 8KB since it will move eight times as many bytes. We can then take a weighted average of the IO size of each customer FlashArray device. This is shown in Figure 3 below.

Figure 3. The weighted-average IO size of all customer arrays.
Looking at the weighted average tells a very different story than looking at raw IOPS. We can see that the most popular read size is between 32KB and 64KB and the most popular write size is between 16KB and 32KB. In fact, the majority of our customers’ arrays have weighted IO sizes above 32KB rather than below 32KB.
| Majority of IOs => 32KB | Majority of IOs => 16KB | |
|
Reads | 71% of arrays |
93% of arrays |
| Writes | 30% of arrays |
79% of arrays |
So how do we reconcile these two different views of the world? IOPS tells us that most IOs are small. But weighted IOPS (throughput) disagrees.
To better understand what is really going on, let’s plot the IOPS and the throughput on the same graph. Figures 4 and 5 show the distribution of IOPS by IO size and the distribution of throughput by IO size across all our customers’ FlashArray devices globally. Figure 4 is writes and Figure 5 is reads.

Figure 4. Distribution of write IO sizes and write throughput sizes across all customer arrays.

Figure 5. Distribution of read IO sizes and read throughput sizes across all customer arrays.
What we observe is that for both reads and writes the IOPS are dominated by small IOs, while the majority of the actual payload is read and written with large IOs.
On average, 79% of all writes are less than 16KB in size, but 74% of all data is written with writes that are greater than 64KB in size. This hopefully sheds some light on how IO size distributions are different when talking about IOPS vs. throughput.
IO Size Modalities: 4 Most Common IO Distributions
So far, we’ve been looking at IO sizes averaged across all FlashArray devices. Now, let’s get away from this aggregation and see if we can spot any patterns in the kinds of workloads that customers are running.
It turns out there are four typical IO size distributions or profiles that are most common, as shown in Figure 6 below. They are:
- Unimodal where one bucket dominates all others
- Bimodal with IOs falling into two buckets
- Trimodal with IOs falling into three buckets
- Multimodal where IOs spread out fairly nicely across most buckets

Figure 6. Examples of the four most common IO size distributions that we observe in customer FlashArrays.
Unimodal is the most prevalent distribution followed by multimodal then bimodal and trimodal. Keep in mind that even a unimodal distribution can represent more than one distinct application running on the array that happens to mostly use the same block size.
Bottom Line on IOPS vs. Throughput: Why Both IO Size and Throughput Matter
We presented a lot of different data above. We saw that typically, reads dominate writes. We saw that typical IO sizes depend on how you look at them. From a strictly IOPS perspective, smaller sizes dominate, but from a throughput perspective, larger sizes do. We also saw that more than half of customer arrays are running a workload with more than one dominant IO size. So how do we pull all this together and make some practical sense of it?
First, we need to look at FlashArray in light of the fact that the world is moving toward consolidation. It’s an uncommon case that a customer purchases an array to run just a single application on it. This isn’t just conjecture. As part of our Pure1® analytics, we apply a predictive algorithm to try to identify which workload is running on each volume of a Pure FlashArray. We’ve extensively validated the accuracy of this model by cross-checking the predictions with customers. We’ve found that 69% of all customer arrays run at least two distinct applications (think VDI and SQL, for example). Just over 25% of customer FlashArray devices run at least three distinct workloads (think VDI, VSI, and SQL, for example). The mixture of different applications on a single FlashArray, as well as variability within the applications themselves, create the complex IO size picture that we see above.
It’s nice to see this validated in practice, but this was the core assumption we made more than seven years ago when we started building FlashArray’s Purity operating environment. Unlike most flash vendors who focused on single-app acceleration, we focused on building affordable flash focused on application virtualization and consolidation from day one, and thus, one of the main design considerations of Purity was a variable block size and metadata architecture. Unlike competitors who break every IO into fixed chunks for analysis (for example, XtremIO at 8K) or who require their deduplication to be tuned to a fixed block size or turned off to save performance per volume (for example Nimble), Pure’s data services are designed to work seamlessly without tuning, for all block sizes, assuming that every array is constantly doing mixed IO (and it turns out that even single-app arrays do tons of mixed-size IO too!). If your vendor is asking you to input, tune, or even think about your application’s IO size, take that as a warning—in the cloud model of IT, you don’t get to control or even ask about what workloads on top of your storage service look like.
So, Pure FlashArray devices are deployed in consolidation environments leading to a complex IO size distribution, but what does that mean from a practical benchmarking perspective? The best way to simulate such complexity accurately is to try running the real workloads that you intend to run in production when evaluating a new storage array. Don’t pick one block size, or two, or three, etc.—any of these narrow approaches miss the mark for real-world applications with multiple IO size modalities, especially in ever-more consolidated environments. Instead, actually try out your real-life workloads—this is the only way to truly capture what’s important in your environment. Testing with real-world IO size mixes has been something that we’ve been passionate about for years. See prior posts on this topic at the end of this article.
All that said, if that kind of testing is not possible or practical, then try to understand the IO size distributions of your workload and test those IO size modalities. And if a single IO size is a requirement, say for quick rule-of-thumb comparison purposes, then we believe 32KB is a pretty reasonable number to use, as it is a logical convergence of the weighted IO size distribution of all customer arrays. As an added bonus, it gets everyone out of the “4K benchmark” thinking that the storage industry has historically propagated for marketing purposes.
Hopefully, this blog sheds some light on how to think about performance in a data-reducing all-flash array, as well as how we’re using big data analytics in Pure1 to not only understand customer environments but also to better design our products. If you’d like to learn more about Pure1, please check out the product page.
Here are a few previous blog posts on the topic of benchmarking:
Written By:
Take Control
Put the AI-driven, SaaS storage management platform to work for your organization.


