One of the biggest challenges for our customers is that it is tough to map VMs back to the array and vice-versa, and troubleshooting storage performance issues is an arduous process that requires multiple tools. To help solve this problem, we announced VM Analytics at Pure//Accelerate and today we are excited to share that it is available to our customers in Pure1®. With VM Analytics, customers will now get full-stack visibility. The main focus for the first version of the product is latency troubleshooting, so we’ll explore this use case.
There are four basic functionalities of VM Analytics – you can change which metric is displayed on the node, you can highlight everything that’s connected to the node, you can filter what you’re seeing, and you can graph the metrics from the node. These are fairly simple actions, but they make a highly versatile product.

First let’s start with the metrics. Changing the metric selected in the top right will change the metric shown on the nodes. This will also determine the sorting of the columns, so if you want to see the VMs that are doing the highest IOPS, you can choose “Total IOPS” and click the tile of the VMs column to change the sort to descending. If you sort ascending here, you will see the VMs that haven’t done any IO during the time period you have selected – these are VMs that you could investigate and potentially reclaim resources.
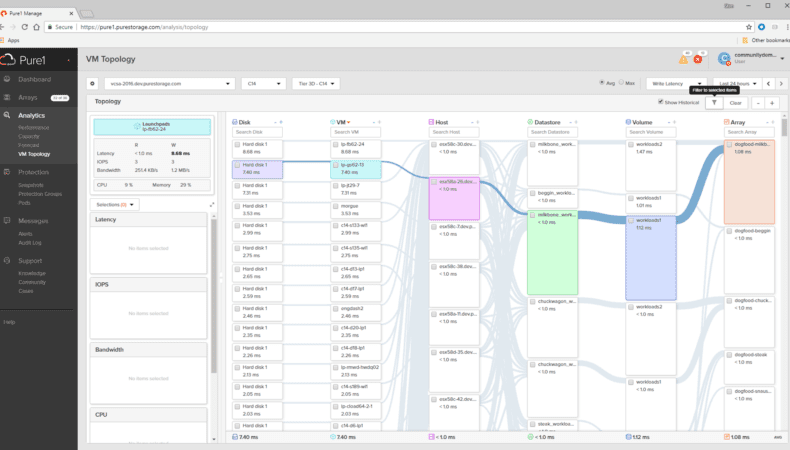
At the very core of the product is the topology map which shows Disks (of course, “Disks” here is just referring to a logical disk since this running on an all-flash array), VMs, Hosts, Datastores, Volumes, and Arrays in the cluster that’s selected in the top left. By clicking on any of the nodes, you can easily see what’s connected to that object. For example, you can select a VM to see which volume or array it’s on. Or you could go the other way and see which VMs are living on a particular volume by selecting the volume.
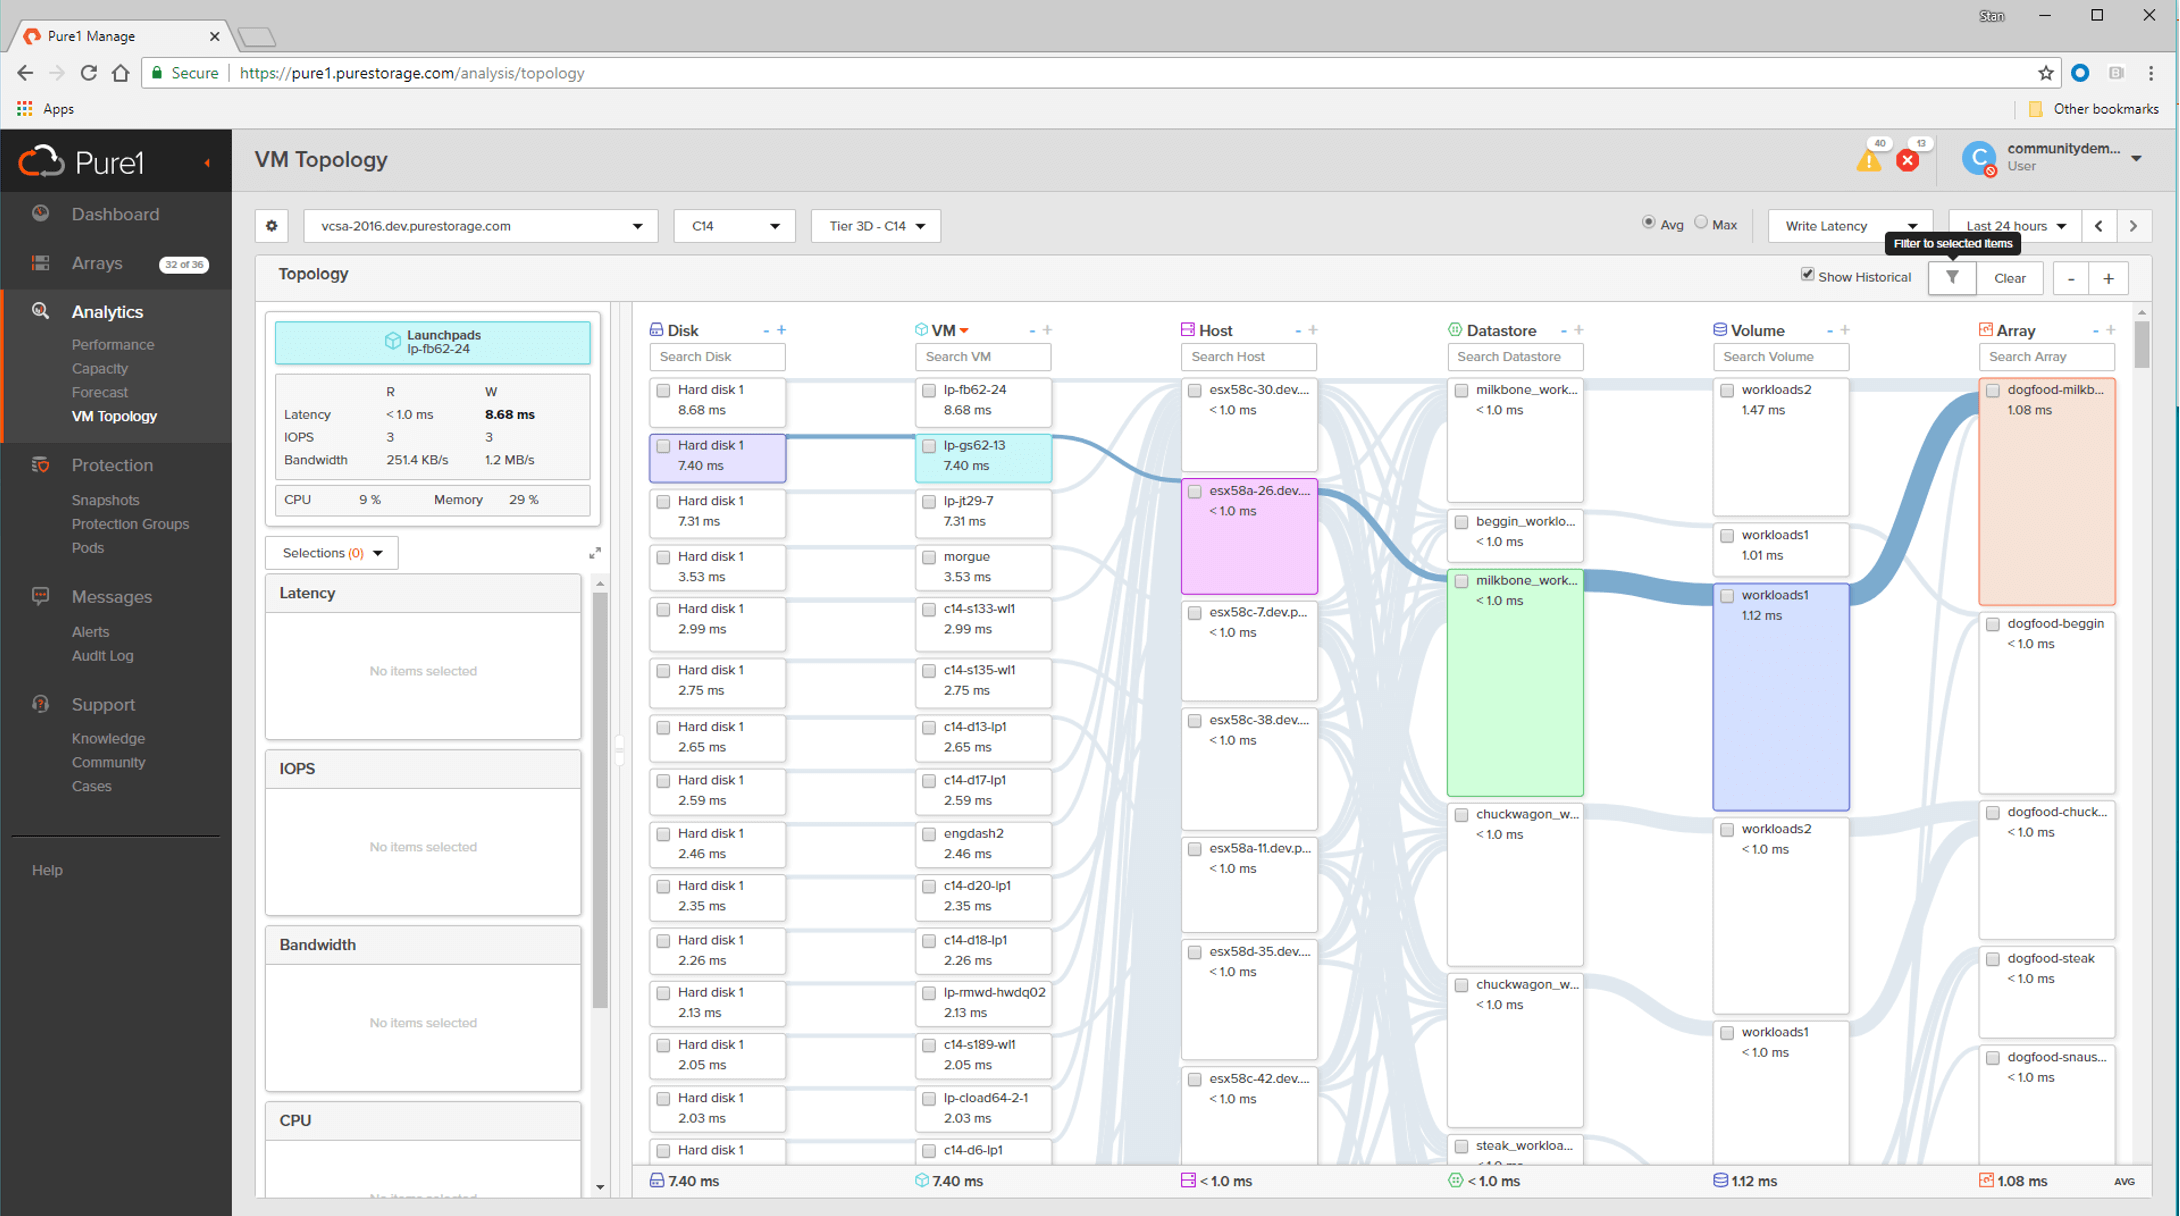
Once you’ve highlighted the path that you want to look at, you can click the filter button to remove the rest of the non-highlighted cluster. This allows you to remove noise and drill down to an array, volume, datastore, host or all the way down to a VM to see what’s going on. You can also use the filter boxes at the top of any column to find exactly what you’re looking for – you can even filter on part of the folder path.
Let’s filter down to a VM and see what’s going on. Here you can see what’s going on along the entire path from a disk all the way through to the array. This allows us to figure out right away whether or not the array is the problem. In this case, the array and the volume has fairly low latency, so we know that the latency is not originating in the array. Moving onto the datastore, this is used as a proxy for the SAN. We can assume that any latency that’s originating in the datastore is introduced in the SAN. At the host level, again we see there’s low latency, so that’s not the problem, but if there was high latency here, we might want to investigate queueing at the host HBAs. Now that we’ve eliminated the rest of the path, we know that for any troubleshooting steps we want to investigate the guest and above.

Once you’ve figured out what you want to look at, you can click the checkbox next on the node to populate the graphs on the left. You can use these graphs to see the timeline of all the metrics, and once you’ve identified the spike, you can click-and-drag across the spike to zoom into that particular time window. This will change the time period for everything in the topology view – so now you can clear the filters and investigate what else might have happened in the rest of your cluster in that specific time window.
Let’s now take a look at a demo, which showcases the simplicity of VM Analytics to troubleshoot performance issues.
This is an extremely exciting product and we are looking forward to seeing how people use this, since latency troubleshooting is just one of many use cases this product has in store. And remember, this is just the first version of the product – we have plenty of things in store for V2 and beyond, so keep an eye out for more news.
